
ホームページ >バックエンド開発 >Python チュートリアル >Python による気象データのクロールと視覚的分析
Python による気象データのクロールと視覚的分析

- 王林転載
- 2023-04-12 18:37:112418ブラウズ

本文
皆さん、こんにちは。私は Python 人工知能テクノロジーです。
私たちは毎日天気予報に注意を払い、または追加することができます。今後の天気に応じて衣服を脱ぐこと、旅行の手配、毎日の気温、風速と風向、相対湿度、空気の質などが注目の焦点になります。温度や湿度の変化曲線、大気質マップ、風向レーダーマップなどの結果が得られ、将来の気象情報を得るのに有効な手段となります。
1. データ取得
Web サイトへのリンクをリクエスト
まず、中国気象網の URL: http://www.weather.com.cn/weather/101280701 を確認してください。 shtml ここでは、地元の天気予報 Web サイトにアクセスします。さまざまな地域をクロールしたい場合は、最後の 101280701 地域番号を変更するだけです。前面の天気予報は 7 日間の Web ページを表し、weather1d は現在の日を表し、weather15d は次の14日。ここでは主に 7 日間および 14 日間の中国気象ネットワークを参照します。 request.get() メソッドを使用して Web ページをリクエストします。アクセスが成功すると、Web ページのすべての文字列テキストが取得されます。これがリクエストのプロセスです。
def getHTMLtext(url):
"""请求获得网页内容"""
 try:
r = requests.get(url, timeout = 30)
r.raise_for_status()
r.encoding = r.apparent_encoding
print("成功访问")
return r.text
 except:
print("访问错误")
 return" "
有用な情報の抽出
BeautifulSoup ライブラリは、取得した文字列からデータを抽出するために使用されます。まず、Web ページをチェックして、データを取得する必要があるタグを見つけます:
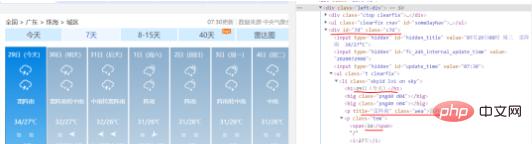
7 日間のデータ情報は id="7d" の div タグ内にあり、日付、天気、気温、風速などの情報は ul タグ内にあることがわかります。と li タグがあるため、BeautifulSoup を使用できます。取得した Web ページのテキストで div タグ id="7d" を検索し、それに含まれるすべての ul タグと li タグを見つけて、タグ内の対応するデータ値を抽出して保存します。それらを対応するリストに追加します。
ここで注意すべき点は、日付に最高気温がない場合があり、データがない状況を判断して処理する必要があることです。さらに、温度の後ろにある摂氏記号、日付数値の抽出、風速テキストの抽出など、一部のデータ保存形式を事前に処理する必要があり、文字検索や文字列のスライス処理が必要になります。
def get_content(html):
"""处理得到有用信息保存数据文件"""
final = []# 初始化一个列表保存数据
bs = BeautifulSoup(html, "html.parser")# 创建BeautifulSoup对象
body = bs.body
data = body.find('div', {'id': '7d'})# 找到div标签且id = 7d
以下は当日のデータをクロールします
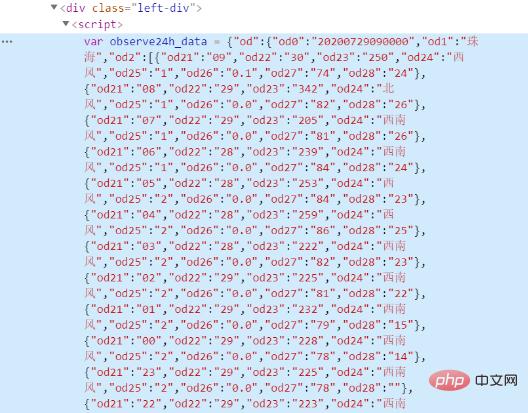
data2 = body.find_all('div',{'class':'left-div'})
text = data2[2].find('script').string
text = text[text.index('=')+1 :-2] # 移除改var data=将其变为json数据
jd = json.loads(text)
dayone = jd['od']['od2'] # 找到当天的数据
final_day = [] # 存放当天的数据
count = 0
for i in dayone:
temp = []
if count <=23:
temp.append(i['od21']) # 添加时间
temp.append(i['od22']) # 添加当前时刻温度
temp.append(i['od24']) # 添加当前时刻风力方向
temp.append(i['od25']) # 添加当前时刻风级
temp.append(i['od26']) # 添加当前时刻降水量
temp.append(i['od27']) # 添加当前时刻相对湿度
temp.append(i['od28']) # 添加当前时刻控制质量
#print(temp)
final_day.append(temp)
count = count +1
以下は7日間のデータをクロールします
ul = data.find('ul')# 找到所有的ul标签
li = ul.find_all('li')# 找到左右的li标签
i = 0 # 控制爬取的天数
for day in li:# 遍历找到的每一个li
if i < 7 and i > 0:
temp = []# 临时存放每天的数据
date = day.find('h1').string # 得到日期
date = date[0:date.index('日')] # 取出日期号
temp.append(date)
inf = day.find_all('p')# 找出li下面的p标签,提取第一个p标签的值,即天气
temp.append(inf[0].string)
 tem_low = inf[1].find('i').string # 找到最低气温
 if inf[1].find('span') is None: # 天气预报可能没有最高气温
 tem_high = None
 else:
 tem_high = inf[1].find('span').string# 找到最高气温
 temp.append(tem_low[:-1])
 if tem_high[-1] == '℃':
temp.append(tem_high[:-1])
 else:
temp.append(tem_high)
 wind = inf[2].find_all('span')# 找到风向
 for j in wind:
temp.append(j['title'])
 wind_scale = inf[2].find('i').string # 找到风级
 index1 = wind_scale.index('级')
 temp.append(int(wind_scale[index1-1:index1]))
 final.append(temp)
i = i + 1
return final_day,final
同様に/weather15dに対して同じ処理を行います:15日間情報, ここを確認したところ、彼の 15 日間の Web ページには 8 ~ 14 日だけが含まれていることがわかりました。前の 1 ~ 7 日間は /weather にありました。ここでは、2 つの Web ページにそれぞれアクセスし、クロールされたデータをマージして最終的なデータを取得しました14 日間のデータ。 - 手前は今後14日間のデータクローリング処理です その日の24時間気象情報データは検索したところjsonデータであることが分かり jsonを通じてその日のデータを取得できます.loads() メソッドを使用して、その日の天気情報を抽出します。
csv ファイルを保存します
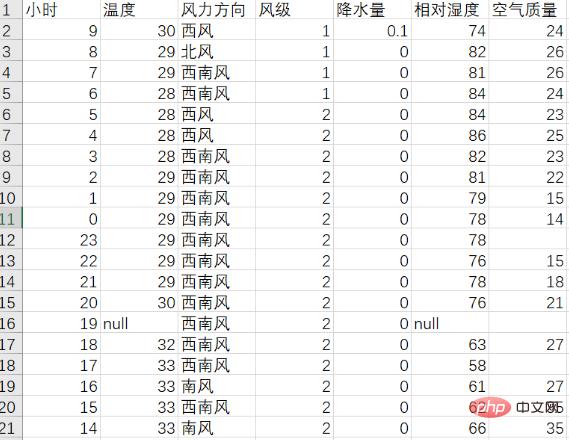
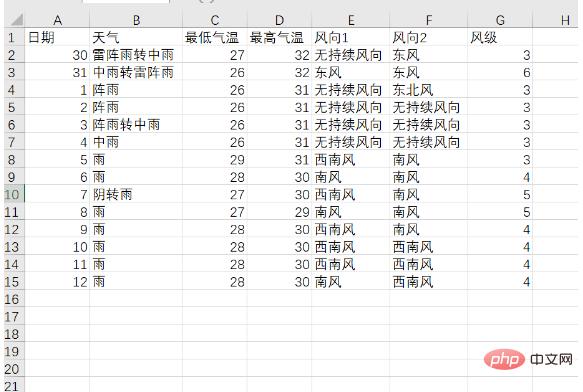
先ほどクロールしたデータをリストに追加し、ここで csv ライブラリを導入し、f_csv.writerow(header) と f_csv を使用します。 writerows(data) メソッドは、テーブルヘッダーと各行のデータをそれぞれ書き込みます。ここでは、1 日と次の 14 日のデータを別々に保存し、それぞれweather1.csvとweather14.csvとして保存します。彼らが保存した表:
2. 視覚的分析
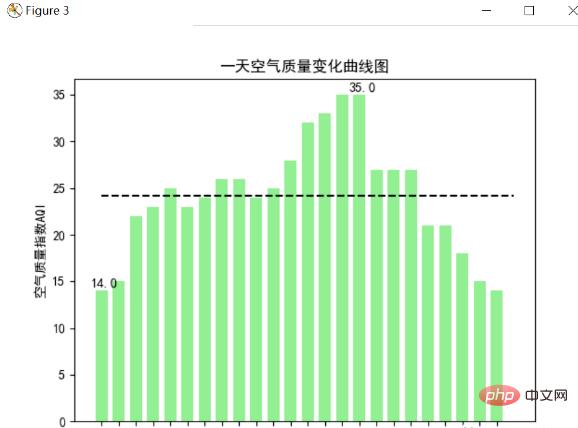
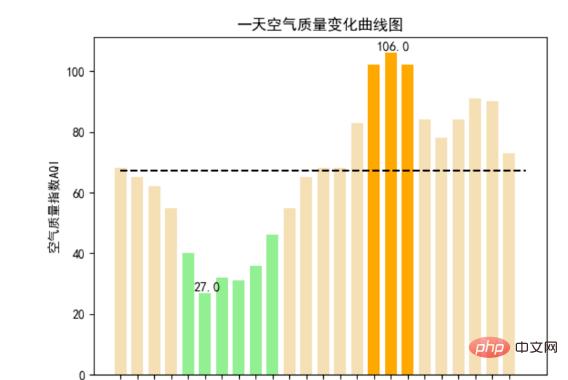
その日の気温変化曲線
matplotlib() メソッドで plt.plot を使用して 1 日 24 時間の温度変化曲線を描画し、plt.text() メソッドを使用して最高気温と最低気温を示し、平均気温の線を描画します。は温度変化曲線です: (コードについては付録を参照)
素晴らしい!プライベートな仕事を引き受けるのに不可欠な N オープンソース プロジェクト!急いで集めてください
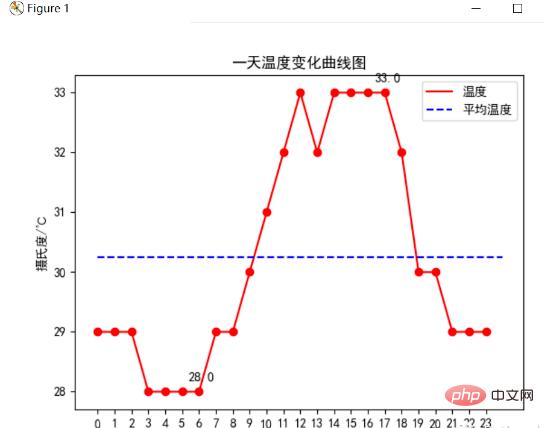
分析の結果、この日の最高気温は33℃、最低気温は28℃、平均気温は約20.4℃であることが分かりました。時間分析により、昼と夜の温度差は5℃あり、早朝は気温が低く、正午から午後にかけて気温が高いことがわかります。
今日の相対湿度変化曲線グラフ
matplotlib の plt.plot() メソッドを使用して、1 日 24 時間の湿度変化曲線を描き、平均相対湿度線を描きます。次の図は、湿度変化曲線グラフを示しています: (コードについては付録を参照)
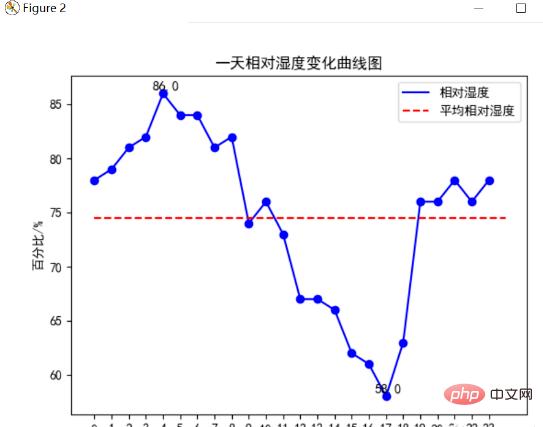
分析により、この日の最高相対湿度は 86%、最低相対湿度は 58°C、平均相対湿度は約 75% であることがわかります。時間分析により、早朝の湿度は比較的高いことがわかります。 、午後から夕暮れまでの湿度は比較的低くなります。
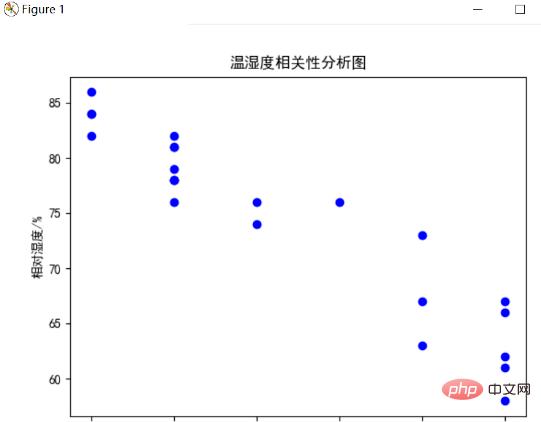
温度と湿度の相関分析チャート
上の 2 つの図の分析を通じて、温度と湿度の間には関係があることがわかります。この関係をより明確かつ直感的に感じるために、 plt.scatter()メソッドで横軸に気温、縦軸に湿度を設定し、グラフ上で各瞬間の点を指摘し、相関係数を計算すると次の図のようになります。
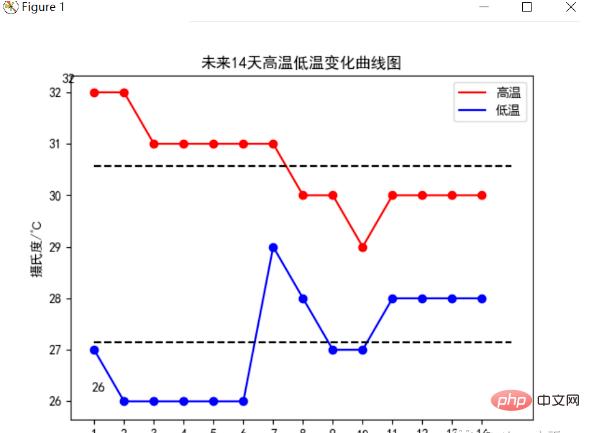
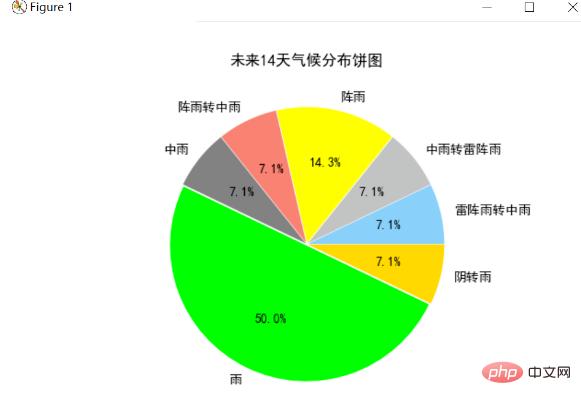
分析可以发现未来14天气候基本是“雨”、“阴转雨”和“阵雨”,下雨的天数较多,结合前面的气温分布图可以看出在第8-9天气温高温下降,可以推测当天下雨,导致气温下降。
3、结论
1.首先根据爬取的温湿度数据进行的分析,温度从早上低到中午高再到晚上低,湿度和温度的趋势相反,通过相关系数发现温度和湿度有强烈的负相关关系,经查阅资料发现因为随着温度升高水蒸汽蒸发加剧,空气中水分降低湿度降低。当然,湿度同时受气压和雨水的影响,下雨湿度会明显增高。
2.经查阅资料空气质量不仅跟工厂、汽车等排放的烟气、废气等有关,更为重要的是与气象因素有关。由于昼夜温差明显变化,当地面温度高于高空温度时,空气上升,污染物易被带到高空扩散;当地面温度低于一定高度的温度时,天空形成逆温层,它像一个大盖子一样压在地面上空,使地表空气中各种污染物不易扩散。一般在晚间和清晨影响较大,而当太阳出来后,地面迅速升温,逆温层就会逐渐消散,于是污染空气也就扩散了。
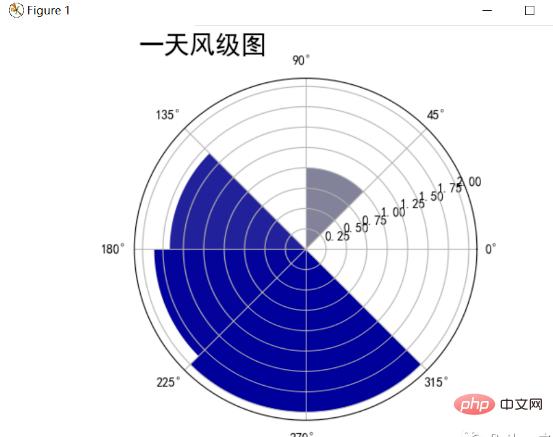
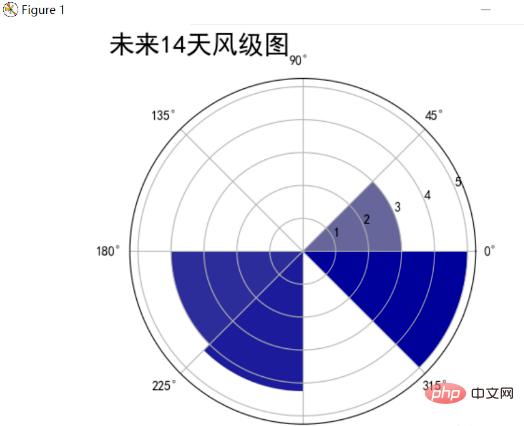
3.风是由气压在水平方向分布的不均匀导致的。风受大气环流、地形、水域等不同因素的综合影响,表现形式多种多样,如季风、地方性的海陆风、山谷风等,一天的风向也有不同的变化,根据未来14天的风向雷达图可以发现未来所有风向基本都有涉及,并且没有特别的某个风向,原因可能是近期没有降水和气文变化不大,导致风向也没有太大的变化规律。
4.天气是指某一个地区距离地表较近的大气层在短时间内的具体状态。跟某瞬时内大气中各种气象要素分布的综合表现。根据未来14天的天气和温度变化可以大致推断出某个时间的气候,天气和温度之间也是有联系的。
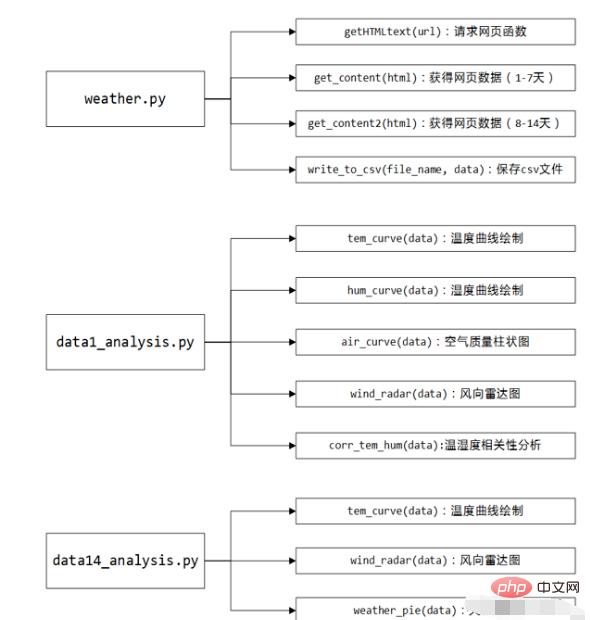
4、代码框架
代码主要分为weather.py:对中国天气网进行爬取天气数据并保存csv文件;data1_analysis.py:对当天的天气信息进行可视化处理;data14_analysis.py:对未来14天的天气信息进行可视化处理。下面是代码的结构图:
附源代码
weather.py
# weather.py
import requests
from bs4 import BeautifulSoup
import csv
import json
def getHTMLtext(url):
"""请求获得网页内容"""
 try:
r = requests.get(url, timeout = 30)
r.raise_for_status()
r.encoding = r.apparent_encoding
print("成功访问")
return r.text
 except:
print("访问错误")
return" "
def get_content(html):
"""处理得到有用信息保存数据文件"""
final = []# 初始化一个列表保存数据
bs = BeautifulSoup(html, "html.parser")# 创建BeautifulSoup对象
body = bs.body
data = body.find('div', {<!-- -->'id': '7d'})# 找到div标签且id = 7d
# 下面爬取当天的数据
data2 = body.find_all('div',{<!-- -->'class':'left-div'})
text = data2[2].find('script').string
text = text[text.index('=')+1 :-2] # 移除改var data=将其变为json数据
jd = json.loads(text)
dayone = jd['od']['od2'] # 找到当天的数据
final_day = [] # 存放当天的数据
count = 0
for i in dayone:
 temp = []
 if count <=23:
temp.append(i['od21']) # 添加时间
temp.append(i['od22']) # 添加当前时刻温度
temp.append(i['od24']) # 添加当前时刻风力方向
temp.append(i['od25']) # 添加当前时刻风级
temp.append(i['od26']) # 添加当前时刻降水量
temp.append(i['od27']) # 添加当前时刻相对湿度
temp.append(i['od28']) # 添加当前时刻控制质量
#print(temp)
final_day.append(temp)
 count = count +1
 # 下面爬取7天的数据
ul = data.find('ul')# 找到所有的ul标签
li = ul.find_all('li')# 找到左右的li标签
i = 0 # 控制爬取的天数
for day in li:# 遍历找到的每一个li
if i < 7 and i > 0:
temp = []# 临时存放每天的数据
date = day.find('h1').string # 得到日期
date = date[0:date.index('日')] # 取出日期号
temp.append(date)
inf = day.find_all('p')# 找出li下面的p标签,提取第一个p标签的值,即天气
temp.append(inf[0].string)
tem_low = inf[1].find('i').string # 找到最低气温
if inf[1].find('span') is None: # 天气预报可能没有最高气温
tem_high = None
else:
tem_high = inf[1].find('span').string# 找到最高气温
temp.append(tem_low[:-1])
if tem_high[-1] == '℃':
 temp.append(tem_high[:-1])
else:
 temp.append(tem_high)
wind = inf[2].find_all('span')# 找到风向
for j in wind:
 temp.append(j['title'])
wind_scale = inf[2].find('i').string # 找到风级
index1 = wind_scale.index('级')
temp.append(int(wind_scale[index1-1:index1]))
final.append(temp)
i = i + 1
return final_day,final
#print(final)
def get_content2(html):
"""处理得到有用信息保存数据文件"""
final = []# 初始化一个列表保存数据
bs = BeautifulSoup(html, "html.parser")# 创建BeautifulSoup对象
body = bs.body
data = body.find('div', {<!-- -->'id': '15d'})# 找到div标签且id = 15d
ul = data.find('ul')# 找到所有的ul标签
li = ul.find_all('li')# 找到左右的li标签
final = []
i = 0 # 控制爬取的天数
for day in li: # 遍历找到的每一个li
if i < 8:
temp = [] # 临时存放每天的数据
date = day.find('span',{<!-- -->'class':'time'}).string# 得到日期
date = date[date.index('(')+1:-2]# 取出日期号
temp.append(date)
weather = day.find('span',{<!-- -->'class':'wea'}).string# 找到天气
temp.append(weather)
tem = day.find('span',{<!-- -->'class':'tem'}).text# 找到温度
temp.append(tem[tem.index('/')+1:-1]) # 找到最低气温
temp.append(tem[:tem.index('/')-1])# 找到最高气温
wind = day.find('span',{<!-- -->'class':'wind'}).string# 找到风向
if '转' in wind: # 如果有风向变化
 temp.append(wind[:wind.index('转')])
 temp.append(wind[wind.index('转')+1:])
else: # 如果没有风向变化,前后风向一致
 temp.append(wind)
 temp.append(wind)
wind_scale = day.find('span',{<!-- -->'class':'wind1'}).string# 找到风级
index1 = wind_scale.index('级')
temp.append(int(wind_scale[index1-1:index1]))
final.append(temp)
return final
def write_to_csv(file_name, data, day=14):
"""保存为csv文件"""
with open(file_name, 'a', errors='ignore', newline='') as f:
 if day == 14:
header = ['日期','天气','最低气温','最高气温','风向1','风向2','风级']
 else:
header = ['小时','温度','风力方向','风级','降水量','相对湿度','空气质量']
 f_csv = csv.writer(f)
 f_csv.writerow(header)
 f_csv.writerows(data)
def main():
"""主函数"""
print("Weather test")
# 珠海
url1 = 'http://www.weather.com.cn/weather/101280701.shtml'# 7天天气中国天气网
url2 = 'http://www.weather.com.cn/weather15d/101280701.shtml' # 8-15天天气中国天气网
html1 = getHTMLtext(url1)
data1, data1_7 = get_content(html1)# 获得1-7天和当天的数据
html2 = getHTMLtext(url2)
data8_14 = get_content2(html2) # 获得8-14天数据
data14 = data1_7 + data8_14
#print(data)
write_to_csv('weather14.csv',data14,14) # 保存为csv文件
write_to_csv('weather1.csv',data1,1)
if __name__ == '__main__':
main()
data1_analysis.py:
# data1_analysis.py
import matplotlib.pyplot as plt
import numpy as np
import pandas as pd
import math
def tem_curve(data):
"""温度曲线绘制"""
hour = list(data['小时'])
tem = list(data['温度'])
for i in range(0,24):
 if math.isnan(tem[i]) == True:
tem[i] = tem[i-1]
 tem_ave = sum(tem)/24 # 求平均温度
tem_max = max(tem)
tem_max_hour = hour[tem.index(tem_max)] # 求最高温度
tem_min = min(tem)
tem_min_hour = hour[tem.index(tem_min)] # 求最低温度
x = []
y = []
for i in range(0, 24):
 x.append(i)
 y.append(tem[hour.index(i)])
plt.figure(1)
plt.plot(x,y,color='red',label='温度') # 画出温度曲线
plt.scatter(x,y,color='red') # 点出每个时刻的温度点
plt.plot([0, 24], [tem_ave, tem_ave], c='blue', linestyle='--',label='平均温度')# 画出平均温度虚线
plt.text(tem_max_hour+0.15, tem_max+0.15, str(tem_max), ha='center', va='bottom', fontsize=10.5)# 标出最高温度
plt.text(tem_min_hour+0.15, tem_min+0.15, str(tem_min), ha='center', va='bottom', fontsize=10.5)# 标出最低温度
plt.xticks(x)
plt.legend()
plt.title('一天温度变化曲线图')
plt.xlabel('时间/h')
plt.ylabel('摄氏度/℃')
plt.show()
def hum_curve(data):
"""相对湿度曲线绘制"""
hour = list(data['小时'])
hum = list(data['相对湿度'])
for i in range(0,24):
 if math.isnan(hum[i]) == True:
hum[i] = hum[i-1]
 hum_ave = sum(hum)/24 # 求平均相对湿度
hum_max = max(hum)
hum_max_hour = hour[hum.index(hum_max)] # 求最高相对湿度
hum_min = min(hum)
hum_min_hour = hour[hum.index(hum_min)] # 求最低相对湿度
x = []
y = []
for i in range(0, 24):
 x.append(i)
 y.append(hum[hour.index(i)])
plt.figure(2)
plt.plot(x,y,color='blue',label='相对湿度') # 画出相对湿度曲线
plt.scatter(x,y,color='blue') # 点出每个时刻的相对湿度
plt.plot([0, 24], [hum_ave, hum_ave], c='red', linestyle='--',label='平均相对湿度')# 画出平均相对湿度虚线
plt.text(hum_max_hour+0.15, hum_max+0.15, str(hum_max), ha='center', va='bottom', fontsize=10.5)# 标出最高相对湿度
plt.text(hum_min_hour+0.15, hum_min+0.15, str(hum_min), ha='center', va='bottom', fontsize=10.5)# 标出最低相对湿度
plt.xticks(x)
plt.legend()
plt.title('一天相对湿度变化曲线图')
plt.xlabel('时间/h')
plt.ylabel('百分比/%')
plt.show()
def air_curve(data):
"""空气质量曲线绘制"""
hour = list(data['小时'])
air = list(data['空气质量'])
print(type(air[0]))
for i in range(0,24):
 if math.isnan(air[i]) == True:
air[i] = air[i-1]
 air_ave = sum(air)/24 # 求平均空气质量
air_max = max(air)
air_max_hour = hour[air.index(air_max)] # 求最高空气质量
air_min = min(air)
air_min_hour = hour[air.index(air_min)] # 求最低空气质量
x = []
y = []
for i in range(0, 24):
 x.append(i)
 y.append(air[hour.index(i)])
plt.figure(3)

for i in range(0,24):
 if y[i] <= 50:
plt.bar(x[i],y[i],color='lightgreen',width=0.7)# 1等级
 elif y[i] <= 100:
plt.bar(x[i],y[i],color='wheat',width=0.7) # 2等级
 elif y[i] <= 150:
plt.bar(x[i],y[i],color='orange',width=0.7) # 3等级
 elif y[i] <= 200:
plt.bar(x[i],y[i],color='orangered',width=0.7)# 4等级
 elif y[i] <= 300:
plt.bar(x[i],y[i],color='darkviolet',width=0.7)# 5等级
 elif y[i] > 300:
plt.bar(x[i],y[i],color='maroon',width=0.7) # 6等级
plt.plot([0, 24], [air_ave, air_ave], c='black', linestyle='--')# 画出平均空气质量虚线
plt.text(air_max_hour+0.15, air_max+0.15, str(air_max), ha='center', va='bottom', fontsize=10.5)# 标出最高空气质量
plt.text(air_min_hour+0.15, air_min+0.15, str(air_min), ha='center', va='bottom', fontsize=10.5)# 标出最低空气质量
plt.xticks(x)
plt.title('一天空气质量变化曲线图')
plt.xlabel('时间/h')
plt.ylabel('空气质量指数AQI')
plt.show()
def wind_radar(data):
"""风向雷达图"""
wind = list(data['风力方向'])
wind_speed = list(data['风级'])
for i in range(0,24):
 if wind[i] == "北风":
wind[i] = 90
 elif wind[i] == "南风":
wind[i] = 270
 elif wind[i] == "西风":
wind[i] = 180
 elif wind[i] == "东风":
wind[i] = 360
 elif wind[i] == "东北风":
wind[i] = 45
 elif wind[i] == "西北风":
wind[i] = 135
 elif wind[i] == "西南风":
wind[i] = 225
 elif wind[i] == "东南风":
wind[i] = 315
degs = np.arange(45,361,45)
temp = []
for deg in degs:
 speed = []
 # 获取 wind_deg 在指定范围的风速平均值数据
 for i in range(0,24):
if wind[i] == deg:
 speed.append(wind_speed[i])
 if len(speed) == 0:
temp.append(0)
 else:
temp.append(sum(speed)/len(speed))
print(temp)
N = 8
theta = np.arange(0.+np.pi/8,2*np.pi+np.pi/8,2*np.pi/8)
# 数据极径
radii = np.array(temp)
# 绘制极区图坐标系
plt.axes(polar=True)
# 定义每个扇区的RGB值(R,G,B),x越大,对应的颜色越接近蓝色
colors = [(1-x/max(temp), 1-x/max(temp),0.6) for x in radii]
plt.bar(theta,radii,width=(2*np.pi/N),bottom=0.0,color=colors)
plt.title('一天风级图',x=0.2,fontsize=20)
plt.show()
def calc_corr(a, b):
"""计算相关系数"""
a_avg = sum(a)/len(a)
b_avg = sum(b)/len(b)
cov_ab = sum([(x - a_avg)*(y - b_avg) for x,y in zip(a, b)])
 sq = math.sqrt(sum([(x - a_avg)**2 for x in a])*sum([(x - b_avg)**2 for x in b]))
corr_factor = cov_ab/sq
return corr_factor
def corr_tem_hum(data):
"""温湿度相关性分析"""
tem = data['温度']
hum = data['相对湿度']
plt.scatter(tem,hum,color='blue')
plt.title("温湿度相关性分析图")
plt.xlabel("温度/℃")
plt.ylabel("相对湿度/%")
plt.text(20,40,"相关系数为:"+str(calc_corr(tem,hum)),fontdict={<!-- -->'size':'10','color':'red'})
plt.show()
print("相关系数为:"+str(calc_corr(tem,hum)))
def main():
plt.rcParams['font.sans-serif']=['SimHei'] # 解决中文显示问题
plt.rcParams['axes.unicode_minus'] = False# 解决负号显示问题
data1 = pd.read_csv('weather1.csv',encoding='gb2312')
print(data1)
tem_curve(data1)
hum_curve(data1)
air_curve(data1)
wind_radar(data1)
corr_tem_hum(data1)
if __name__ == '__main__':
main()
data14_analysis.py:
# data14_analysis.py
import matplotlib.pyplot as plt
import numpy as np
import pandas as pd
import math
def tem_curve(data):
"""温度曲线绘制"""
date = list(data['日期'])
tem_low = list(data['最低气温'])
tem_high = list(data['最高气温'])
for i in range(0,14):
 if math.isnan(tem_low[i]) == True:
tem_low[i] = tem_low[i-1]
 if math.isnan(tem_high[i]) == True:
tem_high[i] = tem_high[i-1]
 tem_high_ave = sum(tem_high)/14 # 求平均高温
 tem_low_ave = sum(tem_low)/14 # 求平均低温

tem_max = max(tem_high)
tem_max_date = tem_high.index(tem_max) # 求最高温度
tem_min = min(tem_low)
tem_min_date = tem_low.index(tem_min) # 求最低温度
x = range(1,15)
plt.figure(1)
plt.plot(x,tem_high,color='red',label='高温')# 画出高温度曲线
plt.scatter(x,tem_high,color='red') # 点出每个时刻的温度点
plt.plot(x,tem_low,color='blue',label='低温')# 画出低温度曲线
plt.scatter(x,tem_low,color='blue') # 点出每个时刻的温度点

plt.plot([1, 15], [tem_high_ave, tem_high_ave], c='black', linestyle='--')# 画出平均温度虚线
plt.plot([1, 15], [tem_low_ave, tem_low_ave], c='black', linestyle='--')# 画出平均温度虚线
plt.legend()
plt.text(tem_max_date+0.15, tem_max+0.15, str(tem_max), ha='center', va='bottom', fontsize=10.5)# 标出最高温度
plt.text(tem_min_date+0.15, tem_min+0.15, str(tem_min), ha='center', va='bottom', fontsize=10.5)# 标出最低温度
plt.xticks(x)
plt.title('未来14天高温低温变化曲线图')
plt.xlabel('未来天数/天')
plt.ylabel('摄氏度/℃')
plt.show()
def change_wind(wind):
"""改变风向"""
for i in range(0,14):
 if wind[i] == "北风":
wind[i] = 90
 elif wind[i] == "南风":
wind[i] = 270
 elif wind[i] == "西风":
wind[i] = 180
 elif wind[i] == "东风":
wind[i] = 360
 elif wind[i] == "东北风":
wind[i] = 45
 elif wind[i] == "西北风":
wind[i] = 135
 elif wind[i] == "西南风":
wind[i] = 225
 elif wind[i] == "东南风":
wind[i] = 315
return wind
def wind_radar(data):
"""风向雷达图"""
wind1 = list(data['风向1'])
wind2 = list(data['风向2'])
wind_speed = list(data['风级'])
wind1 = change_wind(wind1)
wind2 = change_wind(wind2)

degs = np.arange(45,361,45)
temp = []
for deg in degs:
 speed = []
 # 获取 wind_deg 在指定范围的风速平均值数据
 for i in range(0,14):
if wind1[i] == deg:
 speed.append(wind_speed[i])
if wind2[i] == deg:
 speed.append(wind_speed[i])
 if len(speed) == 0:
temp.append(0)
 else:
temp.append(sum(speed)/len(speed))
print(temp)
N = 8
theta = np.arange(0.+np.pi/8,2*np.pi+np.pi/8,2*np.pi/8)
# 数据极径
radii = np.array(temp)
# 绘制极区图坐标系
plt.axes(polar=True)
# 定义每个扇区的RGB值(R,G,B),x越大,对应的颜色越接近蓝色
colors = [(1-x/max(temp), 1-x/max(temp),0.6) for x in radii]
plt.bar(theta,radii,width=(2*np.pi/N),bottom=0.0,color=colors)
plt.title('未来14天风级图',x=0.2,fontsize=20)
plt.show()
def weather_pie(data):
"""绘制天气饼图"""
weather = list(data['天气'])
dic_wea = {<!-- --> }
for i in range(0,14):
 if weather[i] in dic_wea.keys():
dic_wea[weather[i]] += 1
 else:
dic_wea[weather[i]] = 1
print(dic_wea)
explode=[0.01]*len(dic_wea.keys())
color = ['lightskyblue','silver','yellow','salmon','grey','lime','gold','red','green','pink']
plt.pie(dic_wea.values(),explode=explode,labels=dic_wea.keys(),autopct='%1.1f%%',colors=color)
plt.title('未来14天气候分布饼图')
plt.show()
def main():
plt.rcParams['font.sans-serif']=['SimHei'] # 解决中文显示问题
plt.rcParams['axes.unicode_minus'] = False# 解决负号显示问题
data14 = pd.read_csv('weather14.csv',encoding='gb2312')
print(data14)
tem_curve(data14)
wind_radar(data14)
weather_pie(data14)
if __name__ == '__main__':
main()
以上がPython による気象データのクロールと視覚的分析の詳細内容です。詳細については、PHP 中国語 Web サイトの他の関連記事を参照してください。