ホームページ >バックエンド開発 >Python チュートリアル >Python での効率的なデータ処理は一見の価値があります
Python での効率的なデータ処理は一見の価値があります
- 烟雨青岚転載
- 2020-06-16 17:31:592692ブラウズ

一見の価値のある Python の効率的なデータ処理
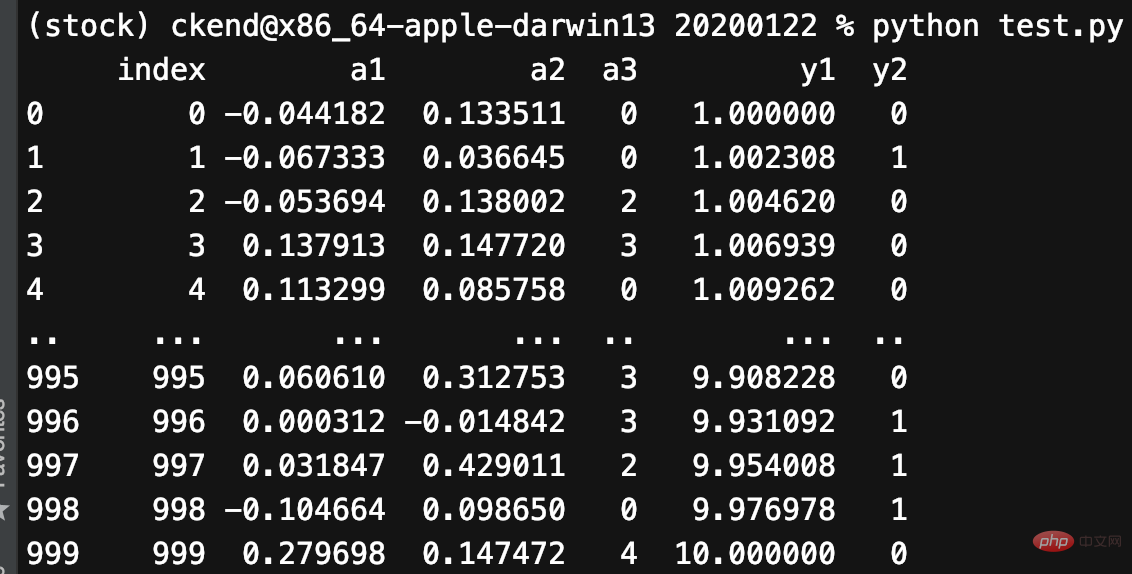
Pandas は Python で非常に一般的に使用されるデータ処理ツールであり、非常に使いやすいです。 NumPy の配列構造上に構築されているため、演算の多くは NumPy や Pandas に付属する拡張モジュールを介して記述されており、これらのモジュールは Cython で記述されて C にコンパイルされ、C 上で実行されるため、処理速度が確保されています。 今日私たちはその力を体験します。1. データの作成
pandas を使用すると簡単にデータを作成できます。ここで、5 列、1000 行の pandas DataFrame を作成しましょう:mu1, sigma1 = 0, 0.1
mu2, sigma2 = 0.2, 0.2
n = 1000df = pd.DataFrame(
{
"a1": pd.np.random.normal(mu1, sigma1, n),
"a2": pd.np.random.normal(mu2, sigma2, n),
"a3": pd.np.random.randint(0, 5, n),
"y1": pd.np.logspace(0, 1, num=n),
"y2": pd.np.random.randint(0, 2, n),
}
) - a1 および a2: 正規 (ガウス) 分布から抽出されたランダム サンプル。
- a3: 0 ~ 4 のランダムな整数。
- y1: 0 から 1 までの対数スケールで均一に分布します。
- y2: 0 から 1 までのランダムな整数。

2. 画像を描画します
Pandas 描画関数matplotlib 座標軸 (Axes) を返すので、必要なものをカスタマイズできます。たとえば、垂直線と平行線を描きます。これは私たちにとって非常に有益です:1. 平均線を描きます
2. 重要な点をマークします
import matplotlib.pyplot as plt
ax = df.y1.plot()
ax.axhline(6, color="red", linestyle="--")
ax.axvline(775, color="red", linestyle="--")
plt.show()

fig, ax = plt.subplots(2, 2, figsize=(14,7))
df.plot(x="index", y="y1", ax=ax[0, 0])
df.plot.scatter(x="index", y="y2", ax=ax[0, 1])
df.plot.scatter(x="index", y="a3", ax=ax[1, 0])
df.plot(x="index", y="a1", ax=ax[1, 1])
plt.show()

Pandas を使用すると、非常に簡単な方法で 2 つのグラフィックの形状比較を取得できます:
df[["a1", "a2"]].plot(bins=30, kind="hist")
plt.show()
 また、複数のグラフィックを描画することもできます:
df[["a1", "a2"]].plot(bins=30, kind="hist", subplots=True)
plt.show()
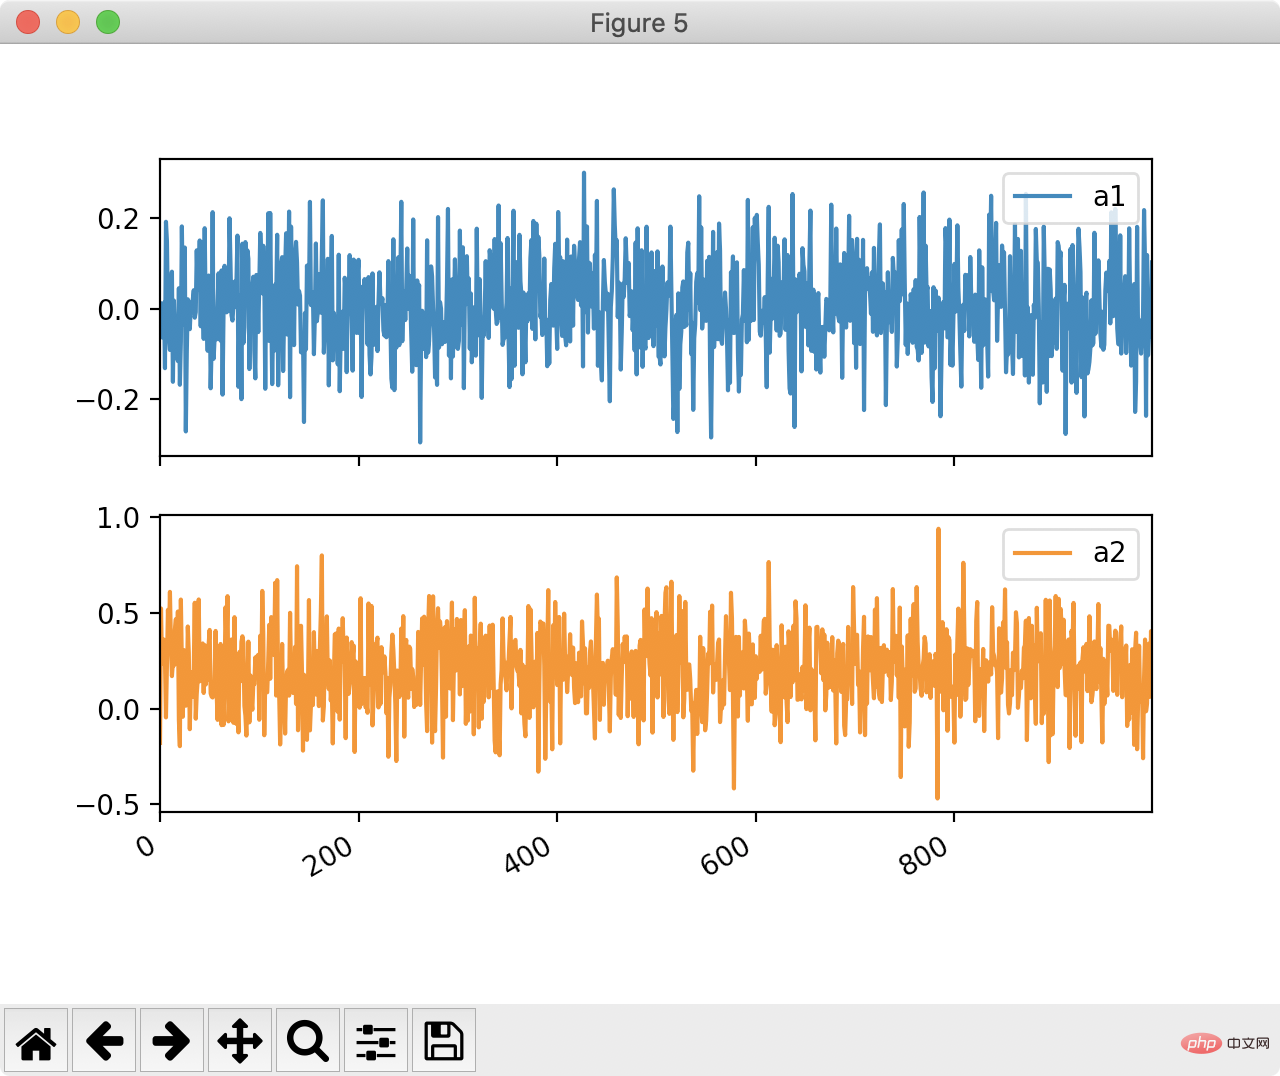
 もちろん、折れ線グラフの生成も簡単ではありません:
df[['a1', 'a2']].plot(by=df.y2, subplots=True)
plt.show()

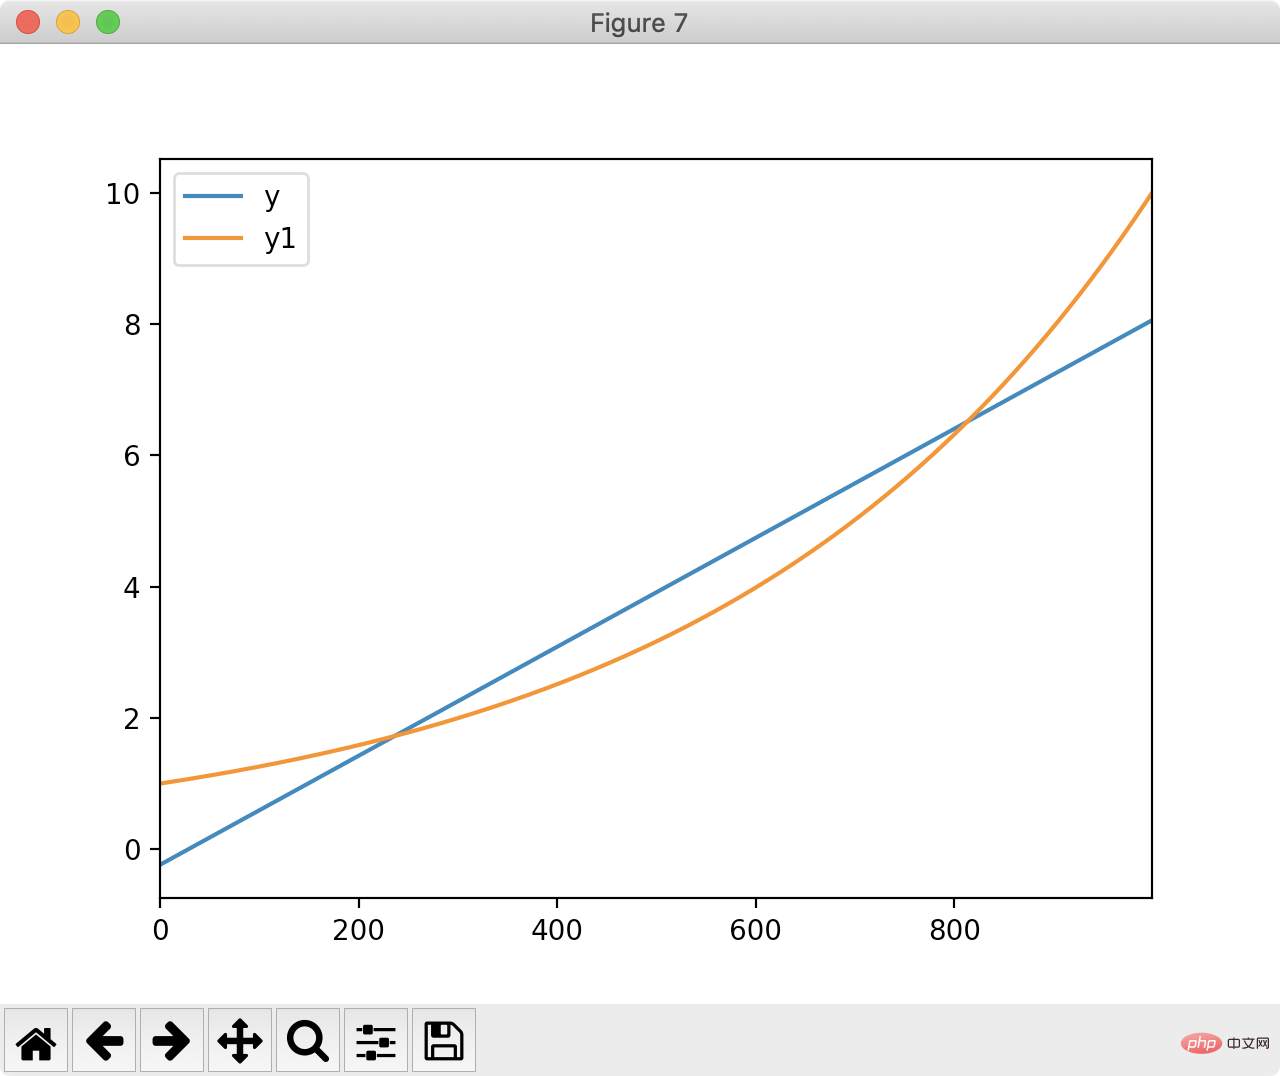
パンダもフィッティングに使用できます。パンダを使用して、次の図に最も近い直線を見つけてみましょう:
 最小二乗法メソッドは最短直線距離を計算します:
df['ones'] = pd.np.ones(len(df))
m, c = pd.np.linalg.lstsq(df[['index', 'ones']], df['y1'], rcond=None)[0]
最小二乗結果に基づいて y と近似直線を描画します:
df['y'] = df['index'].apply(lambda x: x * m + c)
df[['y', 'y1']].plot()
plt.show()
 読んでいただきありがとうございます。多くの恩恵を受けることを願っています。
この記事は、https://blog.csdn.net/u010751000/article/details/106735872
」以上がPython での効率的なデータ処理は一見の価値がありますの詳細内容です。詳細については、PHP 中国語 Web サイトの他の関連記事を参照してください。
声明:
この記事はcsdn.netで複製されています。侵害がある場合は、admin@php.cn までご連絡ください。
前の記事:Python でよくあるエラー次の記事:Python でよくあるエラー

