ホームページ >バックエンド開発 >Python チュートリアル >Matplotlib でのグラフィックの色と線の塗りつぶし
Matplotlib でのグラフィックの色と線の塗りつぶし
- 爱喝马黛茶的安东尼転載
- 2019-06-04 16:31:404857ブラウズ
Matplotlib は、さまざまなハードコピー形式およびさまざまなプラットフォーム上のインタラクティブ環境で出版品質のグラフィックスを生成できる Python 2D プロット ライブラリです。

前の Matplotlib データ視覚化チュートリアルでは、積み上げグラフと円グラフを作成する方法を紹介します。今日紹介するのは、グラフィックの色と線の塗りつぶしです。
#Color
最初に行う変更は、plt.title をstock 変数に変更することです。 。plt.title(stock)それでは、ラベルの色を変更する方法をご紹介します。これは、軸オブジェクトを変更することで実行できます。
ax1.xaxis.label.set_color('c')
ax1.yaxis.label.set_color('r')
これを実行すると、文字通りラベルの色が変わることがわかります。 次に、次のような自動選択ではなく、表示される軸に特定の番号を指定できます。
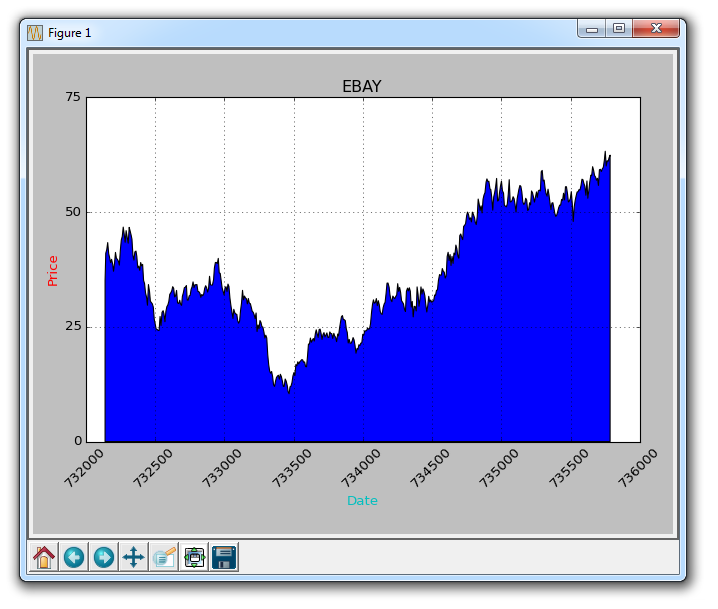
ax1.set_yticks([0,25,50,75])次に、パディングを導入します。 fill は、変数と選択した値の間の色を塗りつぶします。たとえば、これを行うことができます:
ax1.fill_between(date, 0, closep)したがって、ここでのコードは次のとおりです:
import matplotlib.pyplot as plt
import numpy as np
import urllib
import datetime as dt
import matplotlib.dates as mdates

def bytespdate2num(fmt, encoding='utf-8'):
    strconverter = mdates.strpdate2num(fmt)
    def bytesconverter(b):
        s = b.decode(encoding)
        return strconverter(s)
    return bytesconverter


def graph_data(stock):

    fig = plt.figure()
    ax1 = plt.subplot2grid((1,1), (0,0))

    stock_price_url = 'http://chartapi.finance.yahoo.com/instrument/1.0/'+stock+'/chartdata;type=quote;range=10y/csv'
    source_code = urllib.request.urlopen(stock_price_url).read().decode()
    stock_data = []
    split_source = source_code.split('\n')
    for line in split_source:
        split_line = line.split(',')
        if len(split_line) == 6:
            if 'values' not in line and 'labels' not in line:
                stock_data.append(line)


    date, closep, highp, lowp, openp, volume = np.loadtxt(stock_data,
                                                          delimiter=',',
                                                          unpack=True,
                                                          converters={0: bytespdate2num('%Y%m%d')})

    ax1.fill_between(date, 0, closep)

    for label in ax1.xaxis.get_ticklabels():
        label.set_rotation(45)
    ax1.grid(True)#, color='g', linestyle='-', linewidth=5)
    ax1.xaxis.label.set_color('c')
    ax1.yaxis.label.set_color('r')
    ax1.set_yticks([0,25,50,75])

    plt.xlabel('Date')
    plt.ylabel('Price')
    plt.title(stock)
    plt.legend()
    plt.subplots_adjust(left=0.09, bottom=0.20, right=0.94, top=0.90, wspace=0.2, hspace=0)
    plt.show()


graph_data('EBAY')
結果は次のようになります:

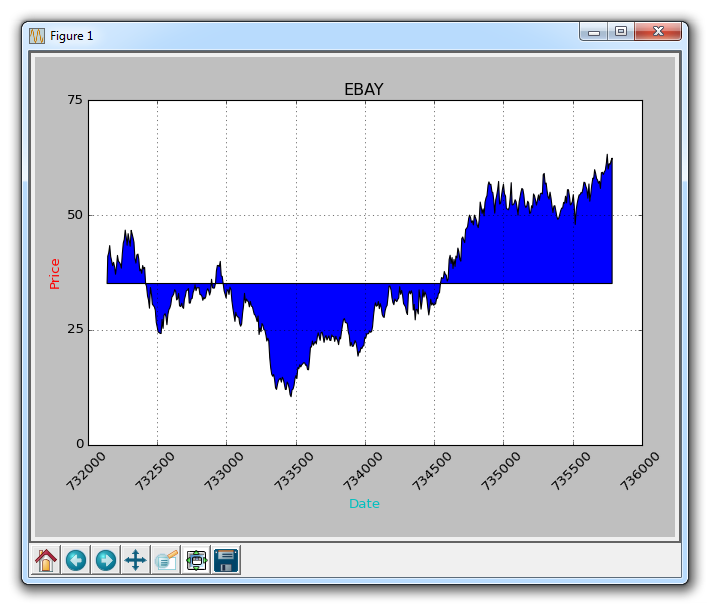
ax1.fill_between(date, 0, closep)さて、条件付き塗りつぶしを導入しましょう。チャート上の開始位置が eBay の購入を開始する位置であると仮定しましょう。ここで、価格がこの価格を下回っている場合は元の価格まで水増しすることができ、元の価格を超えている場合は水増しすることができます。これを行うことができます:
ax1.fill_between(date, closep[0], closep)は次のように生成します:

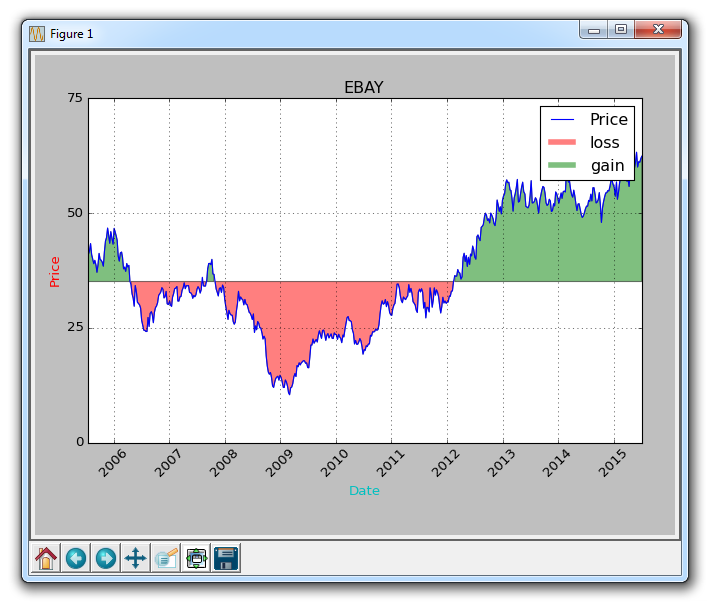
ax1.fill_between(date, closep, closep[0],where=(closep > closep[0]), facecolor='g', alpha=0.5)ここでは、現在の価格と元の価格の間の領域 (現在の価格が元の価格よりも高い) を塗りつぶします。これはライズなので、前景色を緑色にし、わずかな透明度を使用します。
Lines
ax1.plot([],[],linewidth=5, label='loss', color='r',alpha=0.5)
ax1.plot([],[],linewidth=5, label='gain', color='g',alpha=0.5)
ax1.fill_between(date, closep, closep[0],where=(closep > closep[0]), facecolor='g', alpha=0.5)
ax1.fill_between(date, closep, closep[0],where=(closep < closep[0]), facecolor='r', alpha=0.5)
これにより、凡例に表示する予定のラベルを処理するためのパディングと空の行が得られます。完全なコードは次のとおりです:
import matplotlib.pyplot as plt
import numpy as npimport urllib
import datetime as dt
import matplotlib.dates as mdates

def bytespdate2num(fmt, encoding='utf-8'):
    strconverter = mdates.strpdate2num(fmt)
    def bytesconverter(b):
        s = b.decode(encoding)
        return strconverter(s)

    return bytesconverter
def graph_data(stock):

    fig = plt.figure()
    ax1 = plt.subplot2grid((1,1), (0,0))

    stock_price_url = 'http://chartapi.finance.yahoo.com/instrument/1.0/'+stock+'/chartdata;type=quote;range=10y/csv'
    source_code = urllib.request.urlopen(stock_price_url).read().decode()
    stock_data = []
    split_source = source_code.split('\n')
    for line in split_source:
        split_line = line.split(',')
       if len(split_line) == 6:
           if 'values' not in line and 'labels' not in line:
              stock_data.append(line)
    date, closep, highp, lowp, openp, volume = np.loadtxt(stock_data,
                                        delimiter=',',
                                        unpack=True,
                                        converters={0: bytespdate2num('%Y%m%d')})
    ax1.plot_date(date, closep,'-', label='Price')
    ax1.plot([],[],linewidth=5, label='loss', color='r',alpha=0.5)
    ax1.plot([],[],linewidth=5, label='gain', color='g',alpha=0.5)
    ax1.fill_between(date, closep, closep[0],where=(closep > closep[0]), facecolor='g', alpha=0.5)
    ax1.fill_between(date, closep, closep[0],where=(closep < closep[0]), facecolor='r', alpha=0.5)
    for label in ax1.xaxis.get_ticklabels():
       label.set_rotation(45)
    ax1.grid(True)#, color='g', linestyle='-', linewidth=5)
    ax1.xaxis.label.set_color('c')
    ax1.yaxis.label.set_color('r')
    ax1.set_yticks([0,25,50,75])

    plt.xlabel('Date')
    plt.ylabel('Price')
    plt.title(stock)
    plt.legend()
    plt.subplots_adjust(left=0.09, bottom=0.20, right=0.94, top=0.90, wspace=0.2, hspace=0)
    plt.show()
graph_data('EBAY')
結果は次のようになります:

以上がMatplotlib でのグラフィックの色と線の塗りつぶしの詳細内容です。詳細については、PHP 中国語 Web サイトの他の関連記事を参照してください。
声明:
この記事はcsdn.netで複製されています。侵害がある場合は、admin@php.cn までご連絡ください。

