ホームページ >バックエンド開発 >Python チュートリアル >Python は add_subplot と subplot を使用してサブプロットを描画します
Python は add_subplot と subplot を使用してサブプロットを描画します
- 不言オリジナル
- 2018-06-02 14:34:5715958ブラウズ
この記事では、主に add_subplot と subplot を使用してサブプロットを描画するための Python の操作を紹介し、グラフィックス描画のための matplotlib モジュールを使用した Python の関連操作スキルについても説明します。必要な方は参考にしてください。 Pythonのadd_subplotとサブプロットを描画するsubplotが動作します。参考のために皆さんと共有してください。詳細は次のとおりです:
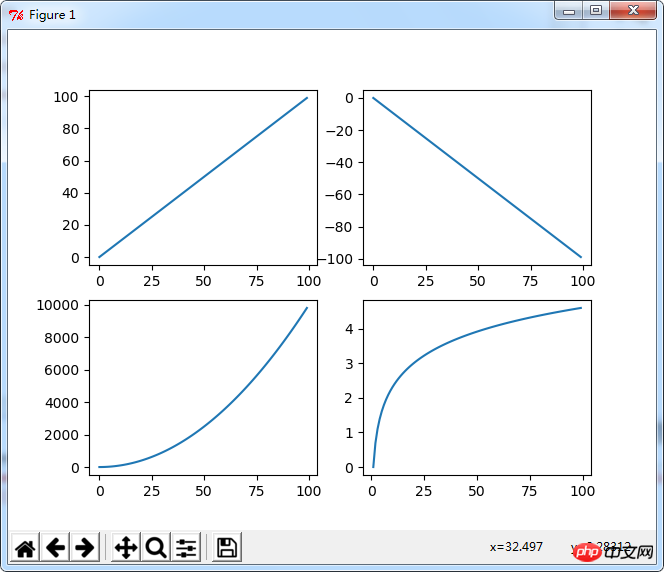
サブピクチャ:1つの図内に複数のサブピクチャを生成します。
Matplotlibオブジェクトの紹介FigureCanvas Canvas Figureと意味は同じです。
オブジェクト指向アプローチの使用

#!/usr/bin/python
#coding: utf-8
import numpy as np
import matplotlib.pyplot as plt
x = np.arange(0, 100)
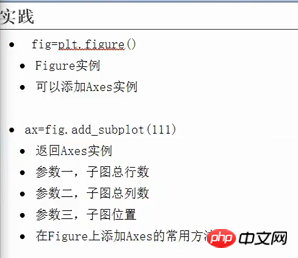
fig = plt.figure()
ax1 = fig.add_subplot(221)
ax1.plot(x, x)
ax2 = fig.add_subplot(222)
ax2.plot(x, -x)
ax3 = fig.add_subplot(223)
ax3.plot(x, x ** 2)
ax4 = fig.add_subplot(224)
ax4.plot(x, np.log(x))
plt.show()
pyplotアプローチplt.subplot()参数和面向对象中的add_subplot()
#!/usr/bin/python
#coding: utf-8
import numpy as np
import matplotlib.pyplot as plt
x = np.arange(0, 100)
plt.subplot(221)
plt.plot(x, x)
plt.subplot(222)
plt.plot(x, -x)
plt.subplot(223)
plt.plot(x, x ** 2)
plt.subplot(224)
plt.plot(x, np.log(x))
plt.show()
実行結果:
関連推奨事項:
Windows API を使用してウィンドウのサンプルを作成する Python

以上がPython は add_subplot と subplot を使用してサブプロットを描画しますの詳細内容です。詳細については、PHP 中国語 Web サイトの他の関連記事を参照してください。

