ホームページ >バックエンド開発 >Python チュートリアル >Python デジタル画像処理スケルトン抽出と分水嶺アルゴリズム
Python デジタル画像処理スケルトン抽出と分水嶺アルゴリズム
- 不言オリジナル
- 2018-04-27 10:25:413853ブラウズ
この記事では主にPythonデジタル画像処理のスケルトン抽出と分水嶺アルゴリズムを紹介しますので、参考にしてください。ぜひ一緒に見てください
スケルトン抽出とウォーターシェッドアルゴリズムも形態素処理のカテゴリに属し、形態素サブモジュールに配置されます。
1. スケルトン抽出
スケルトン抽出。バイナリ画像細線化とも呼ばれます。このアルゴリズムは、特徴抽出とターゲット トポロジ表現のために、接続された領域を 1 ピクセルの幅に絞り込むことができます。
形態学サブモジュールは、スケルトン抽出のための 2 つの関数、つまり Skeletonize() 関数と medial_axis() 関数を提供します。まず Skeletonize() 関数を見てみましょう。
形式は次のとおりです: skimage.morphology.skeletonize(image)
入力と出力は両方ともバイナリイメージです。
例 1:
from skimage import morphology,draw import numpy as np import matplotlib.pyplot as plt #创建一个二值图像用于测试 image = np.zeros((400, 400)) #生成目标对象1(白色U型) image[10:-10, 10:100] = 1 image[-100:-10, 10:-10] = 1 image[10:-10, -100:-10] = 1 #生成目标对象2(X型) rs, cs = draw.line(250, 150, 10, 280) for i in range(10): image[rs + i, cs] = 1 rs, cs = draw.line(10, 150, 250, 280) for i in range(20): image[rs + i, cs] = 1 #生成目标对象3(O型) ir, ic = np.indices(image.shape) circle1 = (ic - 135)**2 + (ir - 150)**2 < 30**2 circle2 = (ic - 135)**2 + (ir - 150)**2 < 20**2 image[circle1] = 1 image[circle2] = 0 #实施骨架算法 skeleton =morphology.skeletonize(image) #显示结果 fig, (ax1, ax2) = plt.subplots(nrows=1, ncols=2, figsize=(8, 4)) ax1.imshow(image, cmap=plt.cm.gray) ax1.axis('off') ax1.set_title('original', fontsize=20) ax2.imshow(skeleton, cmap=plt.cm.gray) ax2.axis('off') ax2.set_title('skeleton', fontsize=20) fig.tight_layout() plt.show()
3 つのターゲット オブジェクトを含むテスト画像を生成し、それぞれスケルトン抽出を実行します。結果は次のとおりです。

例 2: システム独自の馬の画像を使用します。スケルトン抽出
from skimage import morphology,data,color
import matplotlib.pyplot as plt
image=color.rgb2gray(data.horse())
image=1-image #反相
#实施骨架算法
skeleton =morphology.skeletonize(image)
#显示结果
fig, (ax1, ax2) = plt.subplots(nrows=1, ncols=2, figsize=(8, 4))

ax1.imshow(image, cmap=plt.cm.gray)
ax1.axis('off')
ax1.set_title('original', fontsize=20)
ax2.imshow(skeleton, cmap=plt.cm.gray)
ax2.axis('off')
ax2.set_title('skeleton', fontsize=20)
fig.tight_layout()
plt.show()

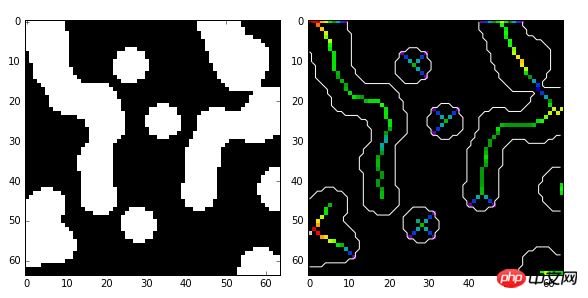
medial_axis は、前景 (1 値) ターゲット オブジェクトの幅を計算するために内側軸を意味します。形式は:
skimage.morphology.です。 medial_axis( image,mask=None,return_ distance=False)
mask: マスク。デフォルトは None です。マスクが指定されている場合、スケルトン アルゴリズムはマスク内のピクセル値に対してのみ実行されます。
return_ distance: ブール値、デフォルトは False の場合、スケルトンを返すことに加えて、距離の変換値も同時に返されます。ここでの距離とは、中心軸上のすべての点と背景点との間の距離を指します。
import numpy as np
import scipy.ndimage as ndi
from skimage import morphology
import matplotlib.pyplot as plt
#编写一个函数,生成测试图像
def microstructure(l=256):
 n = 5
 x, y = np.ogrid[0:l, 0:l]
 mask = np.zeros((l, l))
 generator = np.random.RandomState(1)
 points = l * generator.rand(2, n**2)
 mask[(points[0]).astype(np.int), (points[1]).astype(np.int)] = 1
 mask = ndi.gaussian_filter(mask, sigma=l/(4.*n))
 return mask > mask.mean()
data = microstructure(l=64) #生成测试图像

#计算中轴和距离变换值
skel, distance =morphology.medial_axis(data, return_distance=True)
#中轴上的点到背景像素点的距离
dist_on_skel = distance * skel
fig, (ax1, ax2) = plt.subplots(1, 2, figsize=(8, 4))
ax1.imshow(data, cmap=plt.cm.gray, interpolation='nearest')
#用光谱色显示中轴
ax2.imshow(dist_on_skel, cmap=plt.cm.spectral, interpolation='nearest')
ax2.contour(data, [0.5], colors='w') #显示轮廓线
fig.tight_layout()
plt.show()

2. 分水界アルゴリズム
分水界とは地理における尾根を指し、水は通常、尾根の両側に沿って異なる「集水域」に流れます。ウォーターシェッド アルゴリズムは、画像セグメンテーションの古典的なアルゴリズムであり、トポロジー理論に基づいた数学的形態セグメンテーション手法です。画像内のターゲット オブジェクトが互いに接続されている場合、セグメント化はより困難になります。このような問題に対処するために分水界アルゴリズムがよく使用され、通常はより良い結果が得られます。
分水界アルゴリズムを距離変換と組み合わせて、「集水域」と「分水界の境界」を見つけて画像をセグメント化することができます。バイナリ イメージの距離変換は、各ピクセルから最も近い非ゼロ ピクセルまでの距離です。scipy パッケージを使用して距離変換を計算できます。
以下の例では、重なっている 2 つの円を分離する必要があります。まず、円上のこれらの白いピクセルから黒い背景のピクセルまでの距離変換を計算し、これらのマーカーから開始して、最初のマーカー ポイントとして距離変換の最大値を選択します (反転色の場合は最小値を取得します)。ポイント 二つの集水域はどんどん大きくなり、ついには山の尾根で交差します。山の尾根から切り離されると、2 つの別々の円が得られます。
例 1: 距離変換に基づく山の尾根の画像セグメンテーション
import numpy as np
import matplotlib.pyplot as plt
from scipy import ndimage as ndi
from skimage import morphology,feature
#创建两个带有重叠圆的图像
x, y = np.indices((80, 80))
x1, y1, x2, y2 = 28, 28, 44, 52
r1, r2 = 16, 20
mask_circle1 = (x - x1)**2 + (y - y1)**2 < r1**2
mask_circle2 = (x - x2)**2 + (y - y2)**2 < r2**2
image = np.logical_or(mask_circle1, mask_circle2)
#现在我们用分水岭算法分离两个圆
distance = ndi.distance_transform_edt(image) #距离变换
local_maxi =feature.peak_local_max(distance, indices=False, footprint=np.ones((3, 3)),
labels=image) #寻找峰值
markers = ndi.label(local_maxi)[0] #初始标记点
labels =morphology.watershed(-distance, markers, mask=image) #基于距离变换的分水岭算法
fig, axes = plt.subplots(nrows=2, ncols=2, figsize=(8, 8))
axes = axes.ravel()
ax0, ax1, ax2, ax3 = axes
ax0.imshow(image, cmap=plt.cm.gray, interpolation='nearest')
ax0.set_title("Original")
ax1.imshow(-distance, cmap=plt.cm.jet, interpolation='nearest')
ax1.set_title("Distance")
ax2.imshow(markers, cmap=plt.cm.spectral, interpolation='nearest')
ax2.set_title("Markers")
ax3.imshow(labels, cmap=plt.cm.spectral, interpolation='nearest')
ax3.set_title("Segmented")
for ax in axes:
ax.axis('off')
fig.tight_layout()
plt.show()

分水界アルゴリズムを勾配と組み合わせて画像セグメンテーションを実現することもできます。一般に、グラデーション イメージでは、エッジのピクセル値が高く、他の場所ではピクセル値が低くなります。理想的には、リッジは正確にエッジにある必要があります。したがって、勾配に基づいて尾根を見つけることができます。
例 2: グラデーションベースの流域画像セグメンテーション
import matplotlib.pyplot as plt
from scipy import ndimage as ndi
from skimage import morphology,color,data,filter
image =color.rgb2gray(data.camera())
denoised = filter.rank.median(image, morphology.disk(2)) #过滤噪声
#将梯度值低于10的作为开始标记点
markers = filter.rank.gradient(denoised, morphology.disk(5)) <10
markers = ndi.label(markers)[0]
gradient = filter.rank.gradient(denoised, morphology.disk(2)) #计算梯度
labels =morphology.watershed(gradient, markers, mask=image) #基于梯度的分水岭算法
fig, axes = plt.subplots(nrows=2, ncols=2, figsize=(6, 6))
axes = axes.ravel()
ax0, ax1, ax2, ax3 = axes
ax0.imshow(image, cmap=plt.cm.gray, interpolation='nearest')
ax0.set_title("Original")
ax1.imshow(gradient, cmap=plt.cm.spectral, interpolation='nearest')
ax1.set_title("Gradient")
ax2.imshow(markers, cmap=plt.cm.spectral, interpolation='nearest')
ax2.set_title("Markers")
ax3.imshow(labels, cmap=plt.cm.spectral, interpolation='nearest')
ax3.set_title("Segmented")
for ax in axes:
ax.axis('off')
fig.tight_layout()
plt.show()

関連推奨事項:
以上がPython デジタル画像処理スケルトン抽出と分水嶺アルゴリズムの詳細内容です。詳細については、PHP 中国語 Web サイトの他の関連記事を参照してください。

