ホームページ >ウェブフロントエンド >jsチュートリアル >React で d3 力指向グラフを構築するためのメソッドを共有する
React で d3 力指向グラフを構築するためのメソッドを共有する
- 小云云オリジナル
- 2018-01-15 09:23:222089ブラウズ
この記事では、react で d3 の強制指示グラフを構築する方法を主に紹介します。編集者はそれが非常に優れていると考えたので、参考として共有します。エディターをフォローして見てみましょう。皆さんのお役に立てれば幸いです。
D3js 強制指示グラフ構築
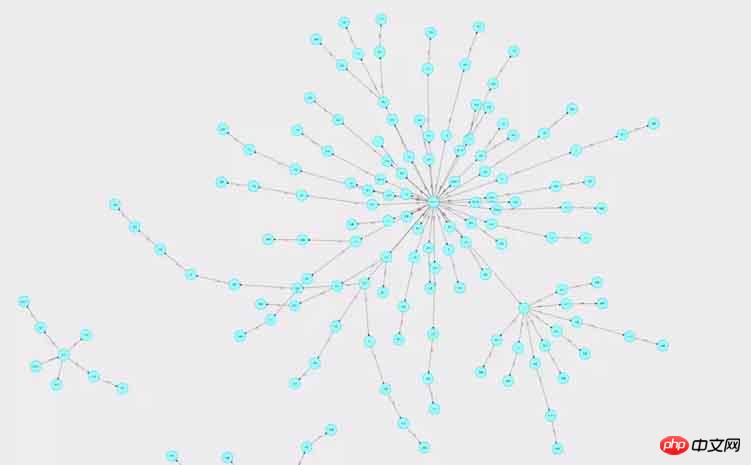
d3js は、データに基づいてドキュメントを操作できる JavaScript ライブラリです。データはHTML、CSS、SVG、Canvasを使用して表示できます。力指向グラフを使用して、ノード間の多対多の関係を表すことができます。
成果効果: 接続に矢印があり、ノードをクリックすると、ノードの色と接続された線の太さを変更したり、ズームしたりドラッグしたりできます。
バージョン: 4.

import React, { Component } from 'react';
import PropTypes from 'prop-types';
import { connect } from 'react-redux';
import { push } from 'react-router-redux';
import * as d3 from 'd3';
import { Row, Form } from 'antd';
import { chartReq} from './actionCreator';
import './Chart.less';
const WIDTH = 1900;
const HEIGHT = 580;
const R = 30;
let simulation;
class Chart extends Component {
constructor(props, context) {
super(props, context);
this.print = this.print.bind(this);
this.forceChart = this.forceChart.bind(this);
this.state = {
};
}
componentWillMount() {
this.props.dispatch(push('/Chart'));
}
componentDidMount() {
this.print();
}
print() {
let callback = (res) => { // callback获取后台返回的数据,并存入state
let nodeData = res.data.nodes;
let relationData = res.data.rels;
this.setState({
nodeData: res.data.nodes,
relationData: res.data.rels,
});
let nodes = [];
for (let i = 0; i < nodeData.length; i++) {
nodes.push({
id: (nodeData[i] && nodeData[i].id) || '',
name: (nodeData[i] && nodeData[i].name) || '',
type: (nodeData[i] && nodeData[i].type) || '',
definition: (nodeData[i] && nodeData[i].definition) || '',
});
}
let edges = [];
for (let i = 0; i < relationData.length; i++) {
edges.push({
id: (relationData[i] && (relationData[i].id)) || '',
source: (relationData[i] && relationData[i].start.id) || '',
target: (relationData[i] && relationData[i].end.id) || '',
tag: (relationData[i] && relationData[i].name) || '',
});
}
this.forceChart(nodes, edges); // d3力导向图内容
};
this.props.dispatch(chartReq({ param: param }, callback));
}
// func
forceChart(nodes, edges) {
this.refs['theChart'].innerHTML = '';
// 函数内其余代码请看拆解代码
}
render() {
return (
<Row style={{ minWidth: 900 }}>
<p className="outerp">
<p className="theChart" id="theChart" ref="theChart">
</p>
</p>
</Row>
);
}
}
Chart.propTypes = {
dispatch: PropTypes.func.isRequired,
};
function mapStateToProps(state) {
return {
};
}
const WrappedChart = Form.create({})(Chart);
export default connect(mapStateToProps)(WrappedChart); 2. コードを逆アセンブルします
1. コンポーネント
<p className="theChart" id="theChart" ref="theChart">
</p>
全体の絵は p で描画されます。
2. ノードと接続を構築します
let nodes = []; // 节点
for (let i = 0; i < nodeData.length; i++) {
nodes.push({
id: (nodeData[i] && nodeData[i].id) || '',
name: (nodeData[i] && nodeData[i].name) || '', // 节点名称
});
}
let edges = []; // 连线
for (let i = 0; i < relationData.length; i++) {
edges.push({
id: (relationData[i] && (relationData[i].id)) || '',
source: (relationData[i] && relationData[i].start.id) || '', // 开始节点
target: (relationData[i] && relationData[i].end.id) || '', // 结束节点
tag: (relationData[i] && relationData[i].name) || '', // 连线名称
});
}具体的な構築はプロジェクト データに基づいています。
3. 力モデルを定義します
const simulation = d3.forceSimulation(nodes) // 指定被引用的nodes数组
  .force('link', d3.forceLink(edges).id(d => d.id).distance(150))
  .force('collision', d3.forceCollide(1).strength(0.1))
  .force('center', d3.forceCenter(WIDTH / 2, HEIGHT / 2))
  .force('charge', d3.forceManyBody().strength(-1000).distanceMax(800));
simulation.force() を通じて力を設定できます:
センタリング: 力の中心、位置を設定します。グラフの中心点。
リンク: 接続の力; . distance は、接続の両端のノード間の距離を設定します。
- 位置決め: 特定の方向に力が与えられます。 simulation.on を通じて聴力図要素の位置の変化を監視します。
- 4. svgを描画します
-
const svg = d3.select('#theChart').append('svg') // 在id为‘theChart'的标签内创建svg
   .style('width', WIDTH)
   .style('height', HEIGHT * 0.9)
   .on('click', () => {
    console.log('click', d3.event.target.tagName);
   })
   .call(zoom); // 缩放
const g = svg.append('g'); // 则svg中创建g
svgを作成し、svg内にgを作成し、g内にノード接続とその他のコンテンツを配置します。
select: 最初の対応する要素を選択します
append: 要素を作成します
5. 接続線を描画します
- rree
- つながり線はベジェ曲線で描画されます: (M 開始点 viewBox: 実際のサイズ、ビューポートを満たすように自動的に拡大縮小されます
const edgesLine = svg.select('g')
  .selectAll('line')
  .data(edges) // 绑定数据
  .enter() // 添加数据到选择集edgepath
  .append('path') // 生成折线
  .attr('d', (d) => { return d && 'M ' + d.source.x + ' ' + d.source.y + ' L ' + d.target.x + ' ' + d.target.y; }) // 遍历所有数据,d表示当前遍历到的数据,返回绘制的贝塞尔曲线
  .attr('id', (d, i) => { return i && 'edgepath' + i; }) // 设置id,用于连线文字
  .attr('marker-end', 'url(#arrow)') // 根据箭头标记的id号标记箭头
  .style('stroke', '#000') // 颜色
  .style('stroke-width', 1); // 粗细
ノードとして円を作成します。
.call() はドラッグ関数を呼び出します。
8. ノード名
- テキストはノードの上層にあるため、マウスイベントが無効になっていない場合、テキストをクリックしてもノードをクリックしても反応しません。ノードはドラッグできません。
- 9. 接続名
const defs = g.append('defs'); // defs定义可重复使用的元素
const arrowheads = defs.append('marker') // 创建箭头
  .attr('id', 'arrow')
  // .attr('markerUnits', 'strokeWidth') // 设置为strokeWidth箭头会随着线的粗细进行缩放
  .attr('markerUnits', 'userSpaceOnUse') // 设置为userSpaceOnUse箭头不受连接元素的影响
  .attr('class', 'arrowhead')
  .attr('markerWidth', 20) // viewport
  .attr('markerHeight', 20) // viewport
  .attr('viewBox', '0 0 20 20') // viewBox
  .attr('refX', 9.3 + R) // 偏离圆心距离
  .attr('refY', 5) // 偏离圆心距离
  .attr('orient', 'auto'); // 绘制方向,可设定为:auto(自动确认方向)和 角度值
arrowheads.append('path')
  .attr('d', 'M0,0 L0,10 L10,5 z') // d: 路径描述,贝塞尔曲线
  .attr('fill', '#000'); // 填充颜色
const nodesCircle = svg.select('g')
  .selectAll('circle')
  .data(nodes)
  .enter()
  .append('circle') // 创建圆
  .attr('r', 30) // 半径
  .style('fill', '#9FF') // 填充颜色
  .style('stroke', '#0CF') // 边框颜色
  .style('stroke-width', 2) // 边框粗细
  .on('click', (node) => { // 点击事件
    console.log('click');
  })
  .call(drag); // 拖拽单个节点带动整个图
10. マウスをノードに移動すると、バブルプロンプトが表示されます
11。画像要素
const nodesTexts = svg.select('g')
  .selectAll('text')
  .data(nodes)
  .enter()
  .append('text')
  .attr('dy', '.3em') // 偏移量
  .attr('text-anchor', 'middle') // 节点名称放在圆圈中间位置
  .style('fill', 'black') // 颜色
  .style('pointer-events', 'none') // 禁止鼠标事件
  .text((d) => { // 文字内容
    return d && d.name; // 遍历nodes每一项,获取对应的name
  });
12. ドラッグ
const edgesText = svg.select('g').selectAll('.edgelabel')
  .data(edges)
  .enter()
  .append('text') // 为每一条连线创建文字区域
  .attr('class', 'edgelabel')
  .attr('dx', 80)
  .attr('dy', 0);
edgesText.append('textPath')// 设置文字内容
  .attr('xlink:href', (d, i) => { return i && '#edgepath' + i; }) // 文字布置在对应id的连线上
  .style('pointer-events', 'none')
  .text((d) => { return d && d.tag; });
13. ズーム
nodesCircle.append('title')
  .text((node) => { // .text设置气泡提示内容
    return node.definition;
  });
3.
1.接続するときは接続線を太くしてください。ノードをクリック
simulation.on('tick', () => {
  // 更新节点坐标
  nodesCircle.attr('transform', (d) => {
    return d && 'translate(' + d.x + ',' + d.y + ')';
  });
  // 更新节点文字坐标
  nodesTexts.attr('transform', (d) => {
    return 'translate(' + (d.x) + ',' + d.y + ')';
  });
  // 更新连线位置
  edgesLine.attr('d', (d) => {
    const path = 'M ' + d.source.x + ' ' + d.source.y + ' L ' + d.target.x + ' ' + d.target.y;
    return path;
  });
  // 更新连线文字位置
  edgesText.attr('transform', (d, i) => {
    return 'rotate(0)';
  });
});
2. クリックしたノードの色が変わりますfunction onDragStart(d) {
// console.log('start');
// console.log(d3.event.active);
if (!d3.event.active) {
simulation.alphaTarget(1) // 设置衰减系数,对节点位置移动过程的模拟,数值越高移动越快,数值范围[0,1]
.restart(); // 拖拽节点后,重新启动模拟
}
d.fx = d.x; // d.x是当前位置,d.fx是静止时位置
d.fy = d.y;
}
function dragging(d) {
d.fx = d3.event.x;
d.fy = d3.event.y;
}
function onDragEnd(d) {
if (!d3.event.active) simulation.alphaTarget(0);
d.fx = null; // 解除dragged中固定的坐标
d.fy = null;
}
const drag = d3.drag()
.on('start', onDragStart)
.on('drag', dragging) // 拖拽过程
.on('end', onDragEnd);
4. React使用時の注意点
function onZoomStart(d) {
  // console.log('start zoom');
}
function zooming(d) {
  // 缩放和拖拽整个g
  // console.log('zoom ing', d3.event.transform, d3.zoomTransform(this));
  g.attr('transform', d3.event.transform); // 获取g的缩放系数和平移的坐标值。
}
function onZoomEnd() {
  // console.log('zoom end');
}
const zoom = d3.zoom()
  // .translateExtent([[0, 0], [WIDTH, HEIGHT]]) // 设置或获取平移区间, 默认为[[-∞, -∞], [+∞, +∞]]
  .scaleExtent([1 / 10, 10]) // 设置最大缩放比例
  .on('start', onZoomStart)
  .on('zoom', zooming)
  .on('end', onZoomEnd);
グラフを構築する場所
ノードと接続データを追加、削除、変更した後、print() 関数を再度呼び出してグラフを再構築する必要があります。
データの取得先 データは redux から取得されるのではなく、リクエストの送信後にコールバックによって直接取得されます。
d3 フォースディレクテッドグラフフォーカスの実装方法
D3.js を使用したテーブルの作成の概要
以上がReact で d3 力指向グラフを構築するためのメソッドを共有するの詳細内容です。詳細については、PHP 中国語 Web サイトの他の関連記事を参照してください。

