ホームページ >バックエンド開発 >Python チュートリアル >matplotlib を使用した Python の単純な描画アニメーションの例
matplotlib を使用した Python の単純な描画アニメーションの例
- 小云云オリジナル
- 2017-12-14 10:42:193810ブラウズ
Matplotlib は、さまざまなハードコピー形式およびクロスプラットフォームのインタラクティブ環境で出版品質のグラフィックスを生成する Python 用の 2D プロット ライブラリです。 Matplotlib を使用すると、開発者はわずか数行のコードでプロット、ヒストグラム、パワー スペクトル、棒グラフ、誤差プロット、散布図などを生成できます。この記事では、主に matplotlib を使用してアニメーションを描画する簡単な例を紹介します。必要な方は参考にしていただければ幸いです。
matplotlibはバージョン1.1.0からアニメーション描画をサポートしています。具体的な使用方法については、公式ヘルプドキュメントを参照してください。これは非常に基本的な例です:
"""
A simple example of an animated plot
"""
import numpy as np
from matplotlib import pyplot as plt
from matplotlib import animation
# First set up the figure, the axis, and the plot element we want to animate
fig = plt.figure()
# create our line object which will be modified in the animation
ax = plt.axes(xlim=(0, 2), ylim=(-2, 2))
# we simply plot an empty line: we'll add data to the line later
line, = ax.plot([], [], lw=2)
# initialization function: plot the background of each frame
def init():
 line.set_data([], [])
 return line,
# animation function. This is called sequentially
# It takes a single parameter, the frame number i
def animate(i):
 x = np.linspace(0, 2, 1000)
 y = np.sin(2 * np.pi * (x - 0.01 * i)) # update the data
 line.set_data(x, y)
 return line,
# Makes an animation by repeatedly calling a function func
# frames can be a generator, an iterable, or a number of frames.
# interval draws a new frame every interval milliseconds.
# blit=True means only re-draw the parts that have changed.
# 在这里设置一个200帧的动画,每帧之间间隔20毫秒
anim = animation.FuncAnimation(fig, animate, init_func=init,
        frames=200, interval=20, blit=True)
# save the animation as an mp4. This requires ffmpeg or mencoder to be
# installed. The extra_args ensure that the x264 codec is used, so that
# the video can be embedded in html5. You may need to adjust this for
# your system: for more information, see
# http://matplotlib.sourceforge.net/api/animation_api.html
anim.save('basic_animation.mp4', fps=30, extra_args=['-vcodec', 'libx264'])

plt.show() # plt.show() 会一直循环播放动画
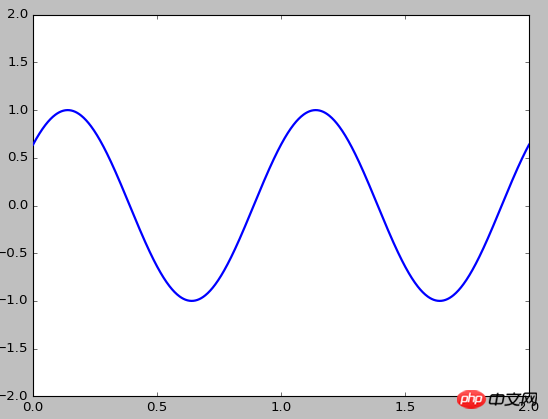
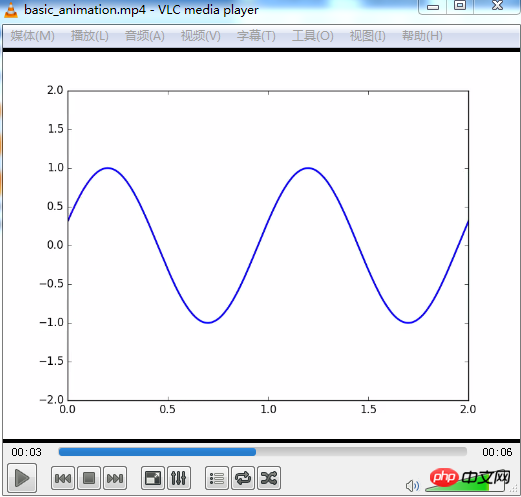
結果:

アニメーションをビデオ ファイルとして mp4 形式で保存したい場合は、最初に FFmpeg をインストールする必要があります。 FFmpeg は、デジタル オーディオとビデオの記録、変換、ストリームへの変換に使用できるオープン ソース コンピューター プログラムのセットです。 LGPL または GPL ライセンスを使用します。オーディオとビデオの記録、変換、ストリーミングのための完全なソリューションを提供します。
ここから Windows バージョンをダウンロードします: DownloadFFmpegforWindows を解凍し、bin ディレクトリをシステム環境変数のパスに追加します。例: C:ProgramFilesffmpeg-3.2.2-win64-staticbin。次に、設定がOKかどうかをテストします: ffmpeg-version を入力してください

matplotlib についての理解が深まったと思いますので、試してみてください。
関連おすすめ:
matplotlibを使って描画するPythonの詳しい説明
以上がmatplotlib を使用した Python の単純な描画アニメーションの例の詳細内容です。詳細については、PHP 中国語 Web サイトの他の関連記事を参照してください。

