


jsPlumb を使用したプロセス描画のフロントエンド コンポーネントについて、以前に 2 つの記事を共有しました。このコンポーネント自体は使いやすく、簡単に始められ、軽量です。しかし、しばらく使用すると、コンポーネントが不安定になるなど、いくつかの欠点が見つかりました。ページの接続スタイルが乱れている場合があります。通常の状態に戻すには、ページを更新する必要があります。また、配線スタイルが比較的単純であるため、最近は視覚的に疲れやすくなっています。いわゆる「インダストリー 4.0」の推進に伴い、自動化制御の要件も増加しており、このグラフィカル インターフェイスの要件も増加しています。そのため、単純な jsPlumb コンポーネントの効果では、成長する企業のビジネスを満足させることができなくなりました。上記に基づいて、私は最終的に、強力な効果と豊富な API を備えた Gojs コンポーネントを見つけました。唯一の欠点は、このコンポーネントが有料コンポーネントであることです。
1. コンポーネントエフェクトのプレビュー
まずは 2 つの素晴らしいエフェクトから始めましょう


下の 2 つのエフェクトに関しては、jsPlumb では実現できませんが、このエフェクトはMES システム、特に一部のプロセスベースのビジネスでは、この効果を使用すると、一目で背が高く感じられます。そして、一見しただけでは、これが Web ページの効果であるとは信じられません。
その他のエフェクト例

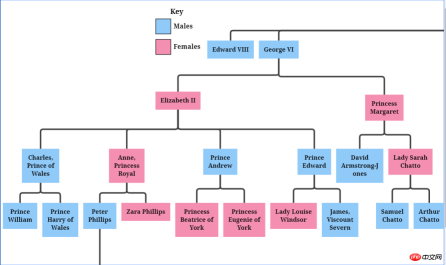
折りたたみ可能なツリー

これは写真ですか?

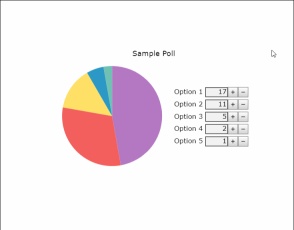
グラフを生成することもできます。


Visio の仕事を獲得したいですか?


その他の例は公式ウェブサイトでご覧いただけます
2. 最初のコンタクト
1. Gojs の紹介
GoJS は機能豊富な J です。 S図書館。 Web ブラウザ カスタム インタラクション ダイアグラムと複雑な視覚効果をプラットフォーム上で実現できます。カスタム テンプレートとレイアウト コンポーネントを使用して、ノード、リンク、グループなどの複雑な JS ダイアグラムを簡素化し、ドラッグなどのユーザー インタラクションのための多くの高度な機能を提供します。アンド ドロップ、コピー、貼り付け、テキスト編集、ツールヒント、コンテキスト メニュー、自動レイアウト、テンプレート、データ バインディングとモデル、トランザクション状態と元に戻す管理、パレット、概要、イベント ハンドラー、コマンド、カスタム アクションのための広範なツール システム。 GoJS はユーザーとの対話を可能にし、ブラウザ内で完全に実行され、サーバーやプラグインを切り替えたり、サーバー側のリクエストを必要とせずに HTML5 Canvas 要素または SVG をレンダリングします。 GoJS は、JS ライブラリやフレームワーク (ブートストラップ、jquery など) に依存せず、HTML や JS フレームワーク、あるいはフレームワークなしでも動作します。
2. はじめに
(1) ファイル参照
コードをコピーします コードは次のとおりです:
<script src="gojs/go-debug_ok.js"></script>
CDN 上の最新バージョンを使用することも、ローカルにダウンロードしたファイルを参照することもできますファイル。開発の場合はデバッグ版の js を引用し、正式に実行する場合は公式の js を引用できます。これについてはこれ以上説明する必要はありません。
(2) キャンバスを作成します
HTML要素をキャンバスとして定義するだけです
コードをコピーしますコードは次のとおりです:
<p id="myDiagramp" style="margin:auto;width:300px; height:300px; background-color:#ddd;"></p>
その後、gojs APIを使用してキャンバスを初期化します
//创建画布
  var objGo = go.GraphObject.make;
  var myDiagram = objGo(go.Diagram, "myDiagramp",
   {
    //模型图的中心位置所在坐标
    initialContentAlignment: go.Spot.Center,

    //允许用户操作图表的时候使用Ctrl-Z撤销和Ctrl-Y重做快捷键
    "undoManager.isEnabled": true,

    //不运行用户改变图表的规模
    allowZoom: false,

    //画布上面是否出现网格
    "grid.visible": true,

    //允许在画布上面双击的时候创建节点
    "clickCreatingTool.archetypeNodeData": { text: "Node" },

    //允许使用ctrl+c、ctrl+v复制粘贴
    "commandHandler.copiesTree": true,

    //允许使用delete键删除节点
    "commandHandler.deletesTree": true,

    // dragging for both move and copy
    "draggingTool.dragsTree": true,
   });
公式の例では、 $ 記号を変数として使用します。ブロガーは $ 記号が敏感すぎると感じているので、名前を変更しましょう~上記のパラメーターはブロガーによって選択されており、キャンバスを初期化するためのその他のパラメーターについては、以下の公式 API の図を参照してください。

(3)创建模型数据(Model)
接着上面的代码,我们增加如下几行
var myModel = objGo(go.Model);//创建Model对象
  // model中的数据每一个js对象都代表着一个相应的模型图中的元素
  myModel.nodeDataArray = [
   { key: "工厂" },
   { key: "车间" },
   { key: "工人" },
   { key: "岗位" },
  ];
  myDiagram.model = myModel; //将模型数据绑定到画布图上
效果预览

(4)创建节点(Node)
上面有了画布和节点数据,只是有了一个雏形,但是还没有任何的图形化效果。我们加入一些效果试试
在gojs里面给我们提供了几种模型节点的可选项:
Shape:形状——Rectangle(矩形)、RoundedRectangle(圆角矩形),Ellipse(椭圆形),Triangle(三角形),Diamond(菱形),Circle(圆形)等
TextBlock:文本域(可编辑)
Picture:图片
Panel:容器来保存其他Node的集合
默认的节点模型代码只是由一个TextBlock组件构建成
我们增加如下一段代码
// 定义一个简单的节点模板
  myDiagram.nodeTemplate =
   objGo(go.Node, "Horizontal",//横向布局的面板
    // 节点淡蓝色背景
    { background: "#44CCFF" },
    objGo(go.Shape,
     "RoundedRectangle", //定义形状,这是圆角矩形
     { /* Shape的参数。宽高颜色等等*/figure: "Club", width: 40, height: 60, margin: 4, fill: 'red' },
     // 绑定 Shape.figure属性为Node.data.fig的值,Model对象可以通过Node.data.fig 获取和设置Shape.figure(修改形状)
     new go.Binding("figure", "fig"), new go.Binding('fill', 'fill2')),
    objGo(go.TextBlock,
     "Default Text", // 默认文本
     // 设置字体大小颜色以及边距
     { margin: 12, stroke: "white", font: "bold 16px sans-serif" },
     //绑定TextBlock.text 属性为Node.data.name的值,Model对象可以通过Node.data.name获取和设置TextBlock.text
     new go.Binding("text", "name"))
   );

  var myModel = objGo(go.Model);//创建Model对象
  // model中的数据每一个js对象都代表着一个相应的模型图中的元素
  myModel.nodeDataArray = [
   { name: "工厂", fig: 'YinYang', fill2: 'blue' },
   { name: "车间", fig: 'Peace', fill2: 'red' },
   { name: "工人", fig: 'NotAllowed', fill2: 'green' },
   { name: "岗位", fig: 'Fragile', fill2: 'yellow' },
  ];
  myDiagram.model = myModel; //将模型数据绑定到画布图上
代码释疑:以上我们给画布对象定义了两种节点模板,一种是文本节点,另一种是形状节点(Node)。在形状节点中,我们定义了数据模型的通用节点样式,就是这一段代码{ /* Shape的参数。宽高颜色等等*/figure: "Club", width: 40, height: 60, margin: 4, fill: 'red' },然后通过new go.Binding("figure", "fig")方法将模板里面的属性映射到数据实例中,比如这里模板里面的figure属性定义的是Club,如果在我们的数据里面定义fig属性,那么它就会覆盖模板里面的figure的默认值。同样,fill和fill2也是通过同样的原理去区别模板中的样式和实例中的实际样式的!
注:更多figure属性的取值详见这里
效果如下

由此可见我们数据里面的属性会覆盖模板的原始属性,如果是新增的节点,由于没有自定义数据属性,所以呈现到界面上面的时候就是模板里面的原生样式!
(5)节点连线
有了上面的基础,我们可以在画布上面画出我们想要的图形效果了,可是还没有连线。我们知道连线是建立在节点模型的上面的,于是乎我们的Model又分为了以下三种类型:
Model:最基本的(不带连线,如上面的例子)
GraphLinksModel :高级点的动态连线图
TreeModel:树形图的模型(从例子看好像用的不多)
GraphLinksModel中为model.nodeDataArray提供model.linkDataArray为node节点连线保存数据模型信息,其实也是的一个JSON数组对象,每个线条都有两个属性 “to” 和 “from” 即Node节点的“key”值,两个属性代表两个key表示两个节点间的连线。
我们上面已经写过最基本的Model的例子了,我们再来个带连线的Model的示例
var myModel = objGo(go.GraphLinksModel);
  myModel.nodeDataArray =
   [
    { key: "aaa" ,name: "工厂" },
    { key: "bbb" ,name: "车间"},
    { key: "ccc" ,name: "车间" }
   ];
  myModel.linkDataArray =
   [
    { from: "aaa", to: "bbb" },
    { from: "bbb", to: "ccc" }
   ];
  myDiagram.model = myModel;
效果如下

学习了Model、GraphLinksModel,还剩下一种TreeModel树节点的模型,这个博主不打算做详细介绍,有兴趣可以直接查看官网。
三、综合效果
关于综合效果,博主不打算将gojs的api逐个翻个遍了,这样太耗时间,伤不起,只是将官方示例中的部分源码截取出来供大家参考。有需要的再细究!
1、自定义流程的使用
<!DOCTYPE html>
<html>
<head>
<meta name="viewport" content="width=device-width, initial-scale=1">
<title>Draggable Link</title>
<meta name="description" content="Drag a link to reconnect it. Nodes have custom Adornments for selection, resizing, and reshaping." />
<!-- Copyright 1998-2017 by Northwoods Software Corporation. -->
<meta charset="UTF-8">
<script src="../../gojs/go-debug.js"></script>
<script id="code">
function init() {
if (window.goSamples) goSamples(); // init for these samples -- you don't need to call this
var objGo = go.GraphObject.make; // for conciseness in defining templates
myDiagram =
objGo(go.Diagram, "myDiagramp", // must name or refer to the p HTML element
{
grid: objGo(go.Panel, "Grid",
objGo(go.Shape, "LineH", { stroke: "lightgray", strokeWidth: 0.5 }),
objGo(go.Shape, "LineH", { stroke: "gray", strokeWidth: 0.5, interval: 10 }),
objGo(go.Shape, "LineV", { stroke: "lightgray", strokeWidth: 0.5 }),
objGo(go.Shape, "LineV", { stroke: "gray", strokeWidth: 0.5, interval: 10 })
),
allowDrop: true, // must be true to accept drops from the Palette
"draggingTool.dragsLink": true,
"draggingTool.isGridSnapEnabled": true,
"linkingTool.isUnconnectedLinkValid": true,
"linkingTool.portGravity": 20,
"relinkingTool.isUnconnectedLinkValid": true,
"relinkingTool.portGravity": 20,
"relinkingTool.fromHandleArchetype":
objGo(go.Shape, "Diamond", { segmentIndex: 0, cursor: "pointer", desiredSize: new go.Size(8, 8), fill: "tomato", stroke: "darkred" }),
"relinkingTool.toHandleArchetype":
objGo(go.Shape, "Diamond", { segmentIndex: -1, cursor: "pointer", desiredSize: new go.Size(8, 8), fill: "darkred", stroke: "tomato" }),
"linkReshapingTool.handleArchetype":
objGo(go.Shape, "Diamond", { desiredSize: new go.Size(7, 7), fill: "lightblue", stroke: "deepskyblue" }),
rotatingTool: objGo(TopRotatingTool), // defined below
"rotatingTool.snapAngleMultiple": 15,
"rotatingTool.snapAngleEpsilon": 15,
"undoManager.isEnabled": true
});
// when the document is modified, add a "*" to the title and enable the "Save" button
myDiagram.addDiagramListener("Modified", function(e) {
var button = document.getElementById("SaveButton");
if (button) button.disabled = !myDiagram.isModified;
var idx = document.title.indexOf("*");
if (myDiagram.isModified) {
if (idx < 0) document.title += "*";
} else {
if (idx >= 0) document.title = document.title.substr(0, idx);
}
});
// Define a function for creating a "port" that is normally transparent.
// The "name" is used as the GraphObject.portId, the "spot" is used to control how links connect
// and where the port is positioned on the node, and the boolean "output" and "input" arguments
// control whether the user can draw links from or to the port.
function makePort(name, spot, output, input) {
// the port is basically just a small transparent square
return objGo(go.Shape, "Circle",
{
fill: null, // not seen, by default; set to a translucent gray by showSmallPorts, defined below
stroke: null,
desiredSize: new go.Size(7, 7),
alignment: spot, // align the port on the main Shape
alignmentFocus: spot, // just inside the Shape
portId: name, // declare this object to be a "port"
fromSpot: spot, toSpot: spot, // declare where links may connect at this port
fromLinkable: output, toLinkable: input, // declare whether the user may draw links to/from here
cursor: "pointer" // show a different cursor to indicate potential link point
});
}
var nodeSelectionAdornmentTemplate =
objGo(go.Adornment, "Auto",
objGo(go.Shape, { fill: null, stroke: "deepskyblue", strokeWidth: 1.5, strokeDashArray: [4, 2] }),
objGo(go.Placeholder)
);
var nodeResizeAdornmentTemplate =
objGo(go.Adornment, "Spot",
{ locationSpot: go.Spot.Right },
objGo(go.Placeholder),
objGo(go.Shape, { alignment: go.Spot.TopLeft, cursor: "nw-resize", desiredSize: new go.Size(6, 6), fill: "lightblue", stroke: "deepskyblue" }),
objGo(go.Shape, { alignment: go.Spot.Top, cursor: "n-resize", desiredSize: new go.Size(6, 6), fill: "lightblue", stroke: "deepskyblue" }),
objGo(go.Shape, { alignment: go.Spot.TopRight, cursor: "ne-resize", desiredSize: new go.Size(6, 6), fill: "lightblue", stroke: "deepskyblue" }),
objGo(go.Shape, { alignment: go.Spot.Left, cursor: "w-resize", desiredSize: new go.Size(6, 6), fill: "lightblue", stroke: "deepskyblue" }),
objGo(go.Shape, { alignment: go.Spot.Right, cursor: "e-resize", desiredSize: new go.Size(6, 6), fill: "lightblue", stroke: "deepskyblue" }),
objGo(go.Shape, { alignment: go.Spot.BottomLeft, cursor: "se-resize", desiredSize: new go.Size(6, 6), fill: "lightblue", stroke: "deepskyblue" }),
objGo(go.Shape, { alignment: go.Spot.Bottom, cursor: "s-resize", desiredSize: new go.Size(6, 6), fill: "lightblue", stroke: "deepskyblue" }),
objGo(go.Shape, { alignment: go.Spot.BottomRight, cursor: "sw-resize", desiredSize: new go.Size(6, 6), fill: "lightblue", stroke: "deepskyblue" })
);
var nodeRotateAdornmentTemplate =
objGo(go.Adornment,
{ locationSpot: go.Spot.Center, locationObjectName: "CIRCLE" },
objGo(go.Shape, "Circle", { name: "CIRCLE", cursor: "pointer", desiredSize: new go.Size(7, 7), fill: "lightblue", stroke: "deepskyblue" }),
objGo(go.Shape, { geometryString: "M3.5 7 L3.5 30", isGeometryPositioned: true, stroke: "deepskyblue", strokeWidth: 1.5, strokeDashArray: [4, 2] })
);
myDiagram.nodeTemplate =
objGo(go.Node, "Spot",
{ locationSpot: go.Spot.Center },
new go.Binding("location", "loc", go.Point.parse).makeTwoWay(go.Point.stringify),
{ selectable: true, selectionAdornmentTemplate: nodeSelectionAdornmentTemplate },
{ resizable: true, resizeObjectName: "PANEL", resizeAdornmentTemplate: nodeResizeAdornmentTemplate },
{ rotatable: true, rotateAdornmentTemplate: nodeRotateAdornmentTemplate },
new go.Binding("angle").makeTwoWay(),
// the main object is a Panel that surrounds a TextBlock with a Shape
objGo(go.Panel, "Auto",
{ name: "PANEL" },
new go.Binding("desiredSize", "size", go.Size.parse).makeTwoWay(go.Size.stringify),
objGo(go.Shape, "Rectangle", // default figure
{
portId: "", // the default port: if no spot on link data, use closest side
fromLinkable: true, toLinkable: true, cursor: "pointer",
fill: "white", // default color
strokeWidth: 2
},
new go.Binding("figure"),
new go.Binding("fill")),
objGo(go.TextBlock,
{
font: "bold 11pt Helvetica, Arial, sans-serif",
margin: 8,
maxSize: new go.Size(160, NaN),
wrap: go.TextBlock.WrapFit,
editable: true
},
new go.Binding("text").makeTwoWay())
),
// four small named ports, one on each side:
makePort("T", go.Spot.Top, false, true),
makePort("L", go.Spot.Left, true, true),
makePort("R", go.Spot.Right, true, true),
makePort("B", go.Spot.Bottom, true, false),
{ // handle mouse enter/leave events to show/hide the ports
mouseEnter: function(e, node) { showSmallPorts(node, true); },
mouseLeave: function(e, node) { showSmallPorts(node, false); }
}
);
function showSmallPorts(node, show) {
node.ports.each(function(port) {
if (port.portId !== "") { // don't change the default port, which is the big shape
port.fill = show ? "rgba(0,0,0,.3)" : null;
}
});
}
var linkSelectionAdornmentTemplate =
objGo(go.Adornment, "Link",
objGo(go.Shape,
// isPanelMain declares that this Shape shares the Link.geometry
{ isPanelMain: true, fill: null, stroke: "deepskyblue", strokeWidth: 0 }) // use selection object's strokeWidth
);
myDiagram.linkTemplate =
objGo(go.Link, // the whole link panel
{ selectable: true, selectionAdornmentTemplate: linkSelectionAdornmentTemplate },
{ relinkableFrom: true, relinkableTo: true, reshapable: true },
{
routing: go.Link.AvoidsNodes,
curve: go.Link.JumpOver,
corner: 5,
toShortLength: 4
},
new go.Binding("points").makeTwoWay(),
objGo(go.Shape, // the link path shape
{ isPanelMain: true, strokeWidth: 2 }),
objGo(go.Shape, // the arrowhead
{ toArrow: "Standard", stroke: null }),
objGo(go.Panel, "Auto",
new go.Binding("visible", "isSelected").ofObject(),
objGo(go.Shape, "RoundedRectangle", // the link shape
{ fill: "#F8F8F8", stroke: null }),
objGo(go.TextBlock,
{
textAlign: "center",
font: "10pt helvetica, arial, sans-serif",
stroke: "#919191",
margin: 2,
minSize: new go.Size(10, NaN),
editable: true
},
new go.Binding("text").makeTwoWay())
)
);
load(); // load an initial diagram from some JSON text
// initialize the Palette that is on the left side of the page
myPalette =
objGo(go.Palette, "myPalettep", // must name or refer to the p HTML element
{
maxSelectionCount: 1,
nodeTemplateMap: myDiagram.nodeTemplateMap, // share the templates used by myDiagram
linkTemplate: // simplify the link template, just in this Palette
objGo(go.Link,
{ // because the GridLayout.alignment is Location and the nodes have locationSpot == Spot.Center,
// to line up the Link in the same manner we have to pretend the Link has the same location spot
locationSpot: go.Spot.Center,
selectionAdornmentTemplate:
objGo(go.Adornment, "Link",
{ locationSpot: go.Spot.Center },
objGo(go.Shape,
{ isPanelMain: true, fill: null, stroke: "deepskyblue", strokeWidth: 0 }),
objGo(go.Shape, // the arrowhead
{ toArrow: "Standard", stroke: null })
)
},
{
routing: go.Link.AvoidsNodes,
curve: go.Link.JumpOver,
corner: 5,
toShortLength: 4
},
new go.Binding("points"),
objGo(go.Shape, // the link path shape
{ isPanelMain: true, strokeWidth: 2 }),
objGo(go.Shape, // the arrowhead
{ toArrow: "Standard", stroke: null })
),
model: new go.GraphLinksModel([ // specify the contents of the Palette
{ text: "Start", figure: "Circle", fill: "#00AD5F" },
{ text: "Step" },
{ text: "DB", figure: "Database", fill: "lightgray" },
{ text: "???", figure: "Diamond", fill: "lightskyblue" },
{ text: "End", figure: "Circle", fill: "#CE0620" },
{ text: "Comment", figure: "RoundedRectangle", fill: "lightyellow" }
], [
// the Palette also has a disconnected Link, which the user can drag-and-drop
{ points: new go.List(go.Point).addAll([new go.Point(0, 0), new go.Point(30, 0), new go.Point(30, 40), new go.Point(60, 40)]) }
])
});
}
function TopRotatingTool() {
go.RotatingTool.call(this);
}
go.Diagram.inherit(TopRotatingTool, go.RotatingTool);
/** @override */
TopRotatingTool.prototype.updateAdornments = function(part) {
go.RotatingTool.prototype.updateAdornments.call(this, part);
var adornment = part.findAdornment("Rotating");
if (adornment !== null) {
adornment.location = part.rotateObject.getDocumentPoint(new go.Spot(0.5, 0, 0, -30)); // above middle top
}
};
/** @override */
TopRotatingTool.prototype.rotate = function(newangle) {
go.RotatingTool.prototype.rotate.call(this, newangle + 90);
};
// end of TopRotatingTool class
// Show the diagram's model in JSON format that the user may edit
function save() {
saveDiagramProperties(); // do this first, before writing to JSON
document.getElementById("mySavedModel").value = myDiagram.model.toJson();
myDiagram.isModified = false;
}
function load() {
myDiagram.model = go.Model.fromJson(document.getElementById("mySavedModel").value);
loadDiagramProperties(); // do this after the Model.modelData has been brought into memory
}
function saveDiagramProperties() {
myDiagram.model.modelData.position = go.Point.stringify(myDiagram.position);
}
function loadDiagramProperties(e) {
// set Diagram.initialPosition, not Diagram.position, to handle initialization side-effects
var pos = myDiagram.model.modelData.position;
if (pos) myDiagram.initialPosition = go.Point.parse(pos);
}
</script>
</head>
<body onload="init()">
<p id="sample">
<p style="width:100%; white-space:nowrap;">
<span style="display: inline-block; vertical-align: top; width:105px">
<p id="myPalettep" style="border: solid 1px black; height: 620px"></p>
</span>
<span style="display: inline-block; vertical-align: top; width:80%">
<p id="myDiagramp" style="border: solid 1px black; height: 620px"></p>
</span>
</p>
<p>
This sample demonstrates the ability for the user to drag around a Link as if it were a Node.
When either end of the link passes over a valid port, the port is highlighted.
</p>
<p>
The link-dragging functionality is enabled by setting some or all of the following properties:
<a>DraggingTool.dragsLink</a>, <a>LinkingTool.isUnconnectedLinkValid</a>, and
<a>RelinkingTool.isUnconnectedLinkValid</a>.
</p>
<p>
Note that a Link is present in the <a>Palette</a> so that it too can be dragged out and onto
the main Diagram. Because links are not automatically routed when either end is not connected
with a Node, the route is provided explicitly when that Palette item is defined.
</p>
<p>
This also demonstrates several custom Adornments:
<a>Part.selectionAdornmentTemplate</a>, <a>Part.resizeAdornmentTemplate</a>, and
<a>Part.rotateAdornmentTemplate</a>.
</p>
<p>
Finally this sample demonstrates saving and restoring the <a>Diagram.position</a> as a property
on the <a>Model.modelData</a> object that is automatically saved and restored when calling <a>Model.toJson</a>
and <a>Model.fromJson</a>.
</p>
<p>
<p>
<button id="SaveButton" onclick="save()">Save</button>
<button onclick="load()">Load</button>
Diagram Model saved in JSON format:
</p>
<textarea id="mySavedModel" style="width:100%;height:300px">
{ "class": "go.GraphLinksModel",
"linkFromPortIdProperty": "fromPort",
"linkToPortIdProperty": "toPort",
"nodeDataArray": [
],
"linkDataArray": [
]}
</textarea>
</p>
</p>
</body>
</html>效果如下:

建议各位copy代码,在本地看到效果,然后再根据实际需求去研究它的api,这样才不会太盲目而花费太多时间。
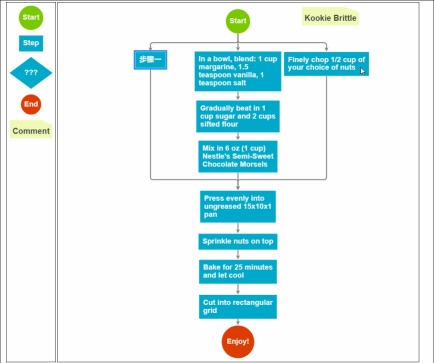
2、工业流程图
<!DOCTYPE html>
<html>
<head>
<meta name="viewport" content="width=device-width, initial-scale=1">
<title>Process Flow</title>
<meta name="description" content="A simple process flow or SCADA diagram editor, simulating equipment monitoring and control." />
<!-- Copyright 1998-2017 by Northwoods Software Corporation. -->
<meta charset="UTF-8">
<script src="../../gojs/go-debug.js"></script>
<script id="code">
function init() {
if (window.goSamples) goSamples(); // init for these samples -- you don't need to call this
var $ = go.GraphObject.make; // for more concise visual tree definitions
myDiagram =
$(go.Diagram, "myDiagramp",
{
"grid.visible": true,
"grid.gridCellSize": new go.Size(30, 20),
"draggingTool.isGridSnapEnabled": true,
"resizingTool.isGridSnapEnabled": true,
"rotatingTool.snapAngleMultiple": 90,
"rotatingTool.snapAngleEpsilon": 45,
"undoManager.isEnabled": true
});
// when the document is modified, add a "*" to the title and enable the "Save" button
myDiagram.addDiagramListener("Modified", function(e) {
var button = document.getElementById("SaveButton");
if (button) button.disabled = !myDiagram.isModified;
var idx = document.title.indexOf("*");
if (myDiagram.isModified) {
if (idx < 0) document.title += "*";
} else {
if (idx >= 0) document.title = document.title.substr(0, idx);
}
});
myDiagram.nodeTemplateMap.add("Process",
$(go.Node, "Auto",
{ locationSpot: new go.Spot(0.5, 0.5), locationObjectName: "SHAPE",
resizable: true, resizeObjectName: "SHAPE" },
new go.Binding("location", "pos", go.Point.parse).makeTwoWay(go.Point.stringify),
$(go.Shape, "Cylinder1",
{ name: "SHAPE",
strokeWidth: 2,
fill: $(go.Brush, "Linear",
{ start: go.Spot.Left, end: go.Spot.Right,
0: "gray", 0.5: "white", 1: "gray" }),
minSize: new go.Size(50, 50),
portId: "", fromSpot: go.Spot.AllSides, toSpot: go.Spot.AllSides
},
new go.Binding("desiredSize", "size", go.Size.parse).makeTwoWay(go.Size.stringify)),
$(go.TextBlock,
{ alignment: go.Spot.Center, textAlign: "center", margin: 5,
editable: true },
new go.Binding("text").makeTwoWay())
));
myDiagram.nodeTemplateMap.add("Valve",
$(go.Node, "Vertical",
{ locationSpot: new go.Spot(0.5, 1, 0, -21), locationObjectName: "SHAPE",
selectionObjectName: "SHAPE", rotatable: true },
new go.Binding("angle").makeTwoWay(),
new go.Binding("location", "pos", go.Point.parse).makeTwoWay(go.Point.stringify),
$(go.TextBlock,
{ alignment: go.Spot.Center, textAlign: "center", margin: 5, editable: true },
new go.Binding("text").makeTwoWay(),
// keep the text upright, even when the whole node has been rotated upside down
new go.Binding("angle", "angle", function(a) { return a === 180 ? 180 : 0; }).ofObject()),
$(go.Shape,
{ name: "SHAPE",
geometryString: "F1 M0 0 L40 20 40 0 0 20z M20 10 L20 30 M12 30 L28 30",
strokeWidth: 2,
fill: $(go.Brush, "Linear", { 0: "gray", 0.35: "white", 0.7: "gray" }),
portId: "", fromSpot: new go.Spot(1, 0.35), toSpot: new go.Spot(0, 0.35) })
));
myDiagram.linkTemplate =
$(go.Link,
{ routing: go.Link.AvoidsNodes, curve: go.Link.JumpGap, corner: 10, reshapable: true, toShortLength: 7 },
new go.Binding("points").makeTwoWay(),
// mark each Shape to get the link geometry with isPanelMain: true
$(go.Shape, { isPanelMain: true, stroke: "black", strokeWidth: 5 }),
$(go.Shape, { isPanelMain: true, stroke: "gray", strokeWidth: 3 }),
$(go.Shape, { isPanelMain: true, stroke: "white", strokeWidth: 1, name: "PIPE", strokeDashArray: [10, 10] }),
$(go.Shape, { toArrow: "Triangle", fill: "black", stroke: null })
);
load();
loop(); // animate some flow through the pipes
}
function loop() {
var diagram = myDiagram;
setTimeout(function() {
var oldskips = diagram.skipsUndoManager;
diagram.skipsUndoManager = true;
diagram.links.each(function(link) {
var shape = link.findObject("PIPE");
var off = shape.strokeDashOffset - 2;
shape.strokeDashOffset = (off <= 0) ? 20 : off;
});
diagram.skipsUndoManager = oldskips;
loop();
}, 100);
}
function save() {
document.getElementById("mySavedModel").value = myDiagram.model.toJson();
myDiagram.isModified = false;
}
function load() {
myDiagram.model = go.Model.fromJson(document.getElementById("mySavedModel").value);
}
</script>
</head>
<body onload="init()">
<p id="sample">
<p id="myDiagramp" style="border: solid 1px black; width:100%; height:500px"></p>
<p>
A <em>process flow diagram</em> is commonly used in chemical and process engineering to indicate the general flow of plant processes and equipment.
A simple SCADA diagram, with animation of the flow along the pipes, is implemented here.
</p>
<p>
The diagram displays the background grid layer by setting <b>grid.visible</b> to true,
and also allows snapping to the grid using <a>DraggingTool.isGridSnapEnabled</a>,
<a>ResizingTool.isGridSnapEnabled</a>, and <a>RotatingTool.snapAngleMultiple</a> alongside <a>RotatingTool.snapAngleEpsilon</a>.
</p>
<p>
The diagram also uses the <b>loop</b> function to animate the links by adjusting the <a>Shape.strokeDashOffset</a> every 100 ms.
</p>
<p>
<p>
<button id="SaveButton" onclick="save()">Save</button>
<button onclick="load()">Load</button>
Diagram Model saved in JSON format:
</p>
<textarea id="mySavedModel" style="width:100%;height:300px">
{ "class": "go.GraphLinksModel",
"nodeDataArray": [
{"key":"P1", "category":"Process", "pos":"150 120", "text":"Process"},
{"key":"P2", "category":"Process", "pos":"330 320", "text":"Tank"},
{"key":"V1", "category":"Valve", "pos":"270 120", "text":"V1"},
{"key":"P3", "category":"Process", "pos":"150 420", "text":"Pump"},
{"key":"V2", "category":"Valve", "pos":"150 280", "text":"VM", "angle":270},
{"key":"V3", "category":"Valve", "pos":"270 420", "text":"V2", "angle":180},
{"key":"P4", "category":"Process", "pos":"450 140", "text":"Reserve Tank"},
{"key":"V4", "category":"Valve", "pos":"390 60", "text":"VA"},
{"key":"V5", "category":"Valve", "pos":"450 260", "text":"VB", "angle":90}
],
"linkDataArray": [
{"from":"P1", "to":"V1"},
{"from":"P3", "to":"V2"},
{"from":"V2", "to":"P1"},
{"from":"P2", "to":"V3"},
{"from":"V3", "to":"P3"},
{"from":"V1", "to":"V4"},
{"from":"V4", "to":"P4"},
{"from":"V1", "to":"P2"},
{"from":"P4", "to":"V5"},
{"from":"V5", "to":"P2"}
]}
</textarea>
</p>
</p>
</body>
</html>工业流程图

四、总结
本文根据js的一些基础用法做了简单介绍,今天就先到这里,以后有问题了再来跟大家分享。如果你的项目里面也有这种业务需求,可以用起来试试!需要说明一点,如果您的公司不缺钱,建议使用正版授权的组件,毕竟尊重作者的劳动成果很重要!
相关推荐:
Javascript-EXTJSコンポーネント開発完了コード
JSコンポーネントのブートストラップテーブルページングの実装で発生した問題を解決
JSコンポーネントに基づいてドラッグスライダー検証機能を実装
以上がJSフロントエンドグラフィカルプラグインツールGojsコンポーネントの詳細内容です。詳細については、PHP 中国語 Web サイトの他の関連記事を参照してください。

 JavaScriptエンジン:実装の比較Apr 13, 2025 am 12:05 AM
さまざまなJavaScriptエンジンは、各エンジンの実装原則と最適化戦略が異なるため、JavaScriptコードを解析および実行するときに異なる効果をもたらします。 1。語彙分析:ソースコードを語彙ユニットに変換します。 2。文法分析:抽象的な構文ツリーを生成します。 3。最適化とコンパイル:JITコンパイラを介してマシンコードを生成します。 4。実行:マシンコードを実行します。 V8エンジンはインスタントコンピレーションと非表示クラスを通じて最適化され、Spidermonkeyはタイプ推論システムを使用して、同じコードで異なるパフォーマンスパフォーマンスをもたらします。
 ブラウザを超えて:現実世界のJavaScriptApr 12, 2025 am 12:06 AM
現実世界におけるJavaScriptのアプリケーションには、サーバー側のプログラミング、モバイルアプリケーション開発、モノのインターネット制御が含まれます。 2。モバイルアプリケーションの開発は、ReactNativeを通じて実行され、クロスプラットフォームの展開をサポートします。 3.ハードウェアの相互作用に適したJohnny-Fiveライブラリを介したIoTデバイス制御に使用されます。
 next.jsを使用してマルチテナントSaaSアプリケーションを構築する(バックエンド統合)Apr 11, 2025 am 08:23 AM
私はあなたの日常的な技術ツールを使用して機能的なマルチテナントSaaSアプリケーション(EDTECHアプリ)を作成しましたが、あなたは同じことをすることができます。 まず、マルチテナントSaaSアプリケーションとは何ですか? マルチテナントSaaSアプリケーションを使用すると、Singの複数の顧客にサービスを提供できます
 next.jsを使用してマルチテナントSaaSアプリケーションを構築する方法(フロントエンド統合)Apr 11, 2025 am 08:22 AM
この記事では、許可によって保護されたバックエンドとのフロントエンド統合を示し、next.jsを使用して機能的なedtech SaaSアプリケーションを構築します。 FrontEndはユーザーのアクセス許可を取得してUIの可視性を制御し、APIリクエストがロールベースに付着することを保証します
 JavaScript:Web言語の汎用性の調査Apr 11, 2025 am 12:01 AM
JavaScriptは、現代のWeb開発のコア言語であり、その多様性と柔軟性に広く使用されています。 1)フロントエンド開発:DOM操作と最新のフレームワーク(React、Vue.JS、Angularなど)を通じて、動的なWebページとシングルページアプリケーションを構築します。 2)サーバー側の開発:node.jsは、非ブロッキングI/Oモデルを使用して、高い並行性とリアルタイムアプリケーションを処理します。 3)モバイルおよびデスクトップアプリケーション開発:クロスプラットフォーム開発は、反応および電子を通じて実現され、開発効率を向上させます。
 JavaScriptの進化:現在の傾向と将来の見通しApr 10, 2025 am 09:33 AM
JavaScriptの最新トレンドには、TypeScriptの台頭、最新のフレームワークとライブラリの人気、WebAssemblyの適用が含まれます。将来の見通しは、より強力なタイプシステム、サーバー側のJavaScriptの開発、人工知能と機械学習の拡大、およびIoTおよびEDGEコンピューティングの可能性をカバーしています。
 javascriptの分解:それが何をするのか、なぜそれが重要なのかApr 09, 2025 am 12:07 AM
JavaScriptは現代のWeb開発の基礎であり、その主な機能には、イベント駆動型のプログラミング、動的コンテンツ生成、非同期プログラミングが含まれます。 1)イベント駆動型プログラミングにより、Webページはユーザー操作に応じて動的に変更できます。 2)動的コンテンツ生成により、条件に応じてページコンテンツを調整できます。 3)非同期プログラミングにより、ユーザーインターフェイスがブロックされないようにします。 JavaScriptは、Webインタラクション、シングルページアプリケーション、サーバー側の開発で広く使用されており、ユーザーエクスペリエンスとクロスプラットフォーム開発の柔軟性を大幅に改善しています。
 pythonまたはjavascriptの方がいいですか?Apr 06, 2025 am 12:14 AM
Pythonはデータサイエンスや機械学習により適していますが、JavaScriptはフロントエンドとフルスタックの開発により適しています。 1. Pythonは、簡潔な構文とリッチライブラリエコシステムで知られており、データ分析とWeb開発に適しています。 2。JavaScriptは、フロントエンド開発の中核です。 node.jsはサーバー側のプログラミングをサポートしており、フルスタック開発に適しています。


ホットAIツール

Undresser.AI Undress
リアルなヌード写真を作成する AI 搭載アプリ

AI Clothes Remover
写真から衣服を削除するオンライン AI ツール。

Undress AI Tool
脱衣画像を無料で

Clothoff.io
AI衣類リムーバー

AI Hentai Generator
AIヘンタイを無料で生成します。

人気の記事
ホットツール

ゼンドスタジオ 13.0.1
強力な PHP 統合開発環境

Dreamweaver Mac版
ビジュアル Web 開発ツール

WebStorm Mac版
便利なJavaScript開発ツール

SublimeText3 Mac版
神レベルのコード編集ソフト(SublimeText3)

mPDF
mPDF は、UTF-8 でエンコードされた HTML から PDF ファイルを生成できる PHP ライブラリです。オリジナルの作者である Ian Back は、Web サイトから「オンザフライ」で PDF ファイルを出力し、さまざまな言語を処理するために mPDF を作成しました。 HTML2FPDF などのオリジナルのスクリプトよりも遅く、Unicode フォントを使用すると生成されるファイルが大きくなりますが、CSS スタイルなどをサポートし、多くの機能強化が施されています。 RTL (アラビア語とヘブライ語) や CJK (中国語、日本語、韓国語) を含むほぼすべての言語をサポートします。ネストされたブロックレベル要素 (P、DIV など) をサポートします。

