
ホームページ >バックエンド開発 >Python チュートリアル >Pythonでグラフィックを描画する例を詳しく解説
Pythonでグラフィックを描画する例を詳しく解説

- PHP中文网オリジナル
- 2017-06-20 15:55:325448ブラウズ
1. 環境
システム:windows10
Pythonバージョン:python3.6.1
使用ライブラリ:matplotlib、numpy
2 numpyライブラリが乱数を生成するにはいくつかの方法があります。うんこ.random
rand(d0, d1, ..., dn)
3. 散布図randn(d0, d1, ..., dn) クエリ結果は標準正規分布です In [2]: x=np.random.rand(2,5) In [3]: x Out[3] ]:
配列([[ 0.84286554, 0.50007593, 0.66500549, 0.97387807, 0.03993009],[ 0.46391661, 0.50717355, 0.21527461, 0. 17、0.2567891 ]])
In [4]: x=np.random.randn(2,5) In [5]: x randint(low,high,size)Out[5]:
array([[ -0.77195196、0.26651203、-0.35045793、-0.0210377、0.89749635]、[-0.20229338、1.44852833、-0.10858996、-1.65034606、 635]])
の間で生成されます低値と高値 (半開区間 [低値、高値)]、サイズ データ In [6]: x=np.random.randint(1,8,4)In [7]: x random_integers(low,high,size)Out[7] : array([ 4, 4, 2, 7])
LowとHighの間(閉区間[low, high)]を生成し、サイズデータ In [ 10] : x=np.random.random_integers(2,10,5)In [11]: x Out[11]: array([7, 4, 5, 4, 2])
import numpy as np
rreee
4. 折れ線グラフ
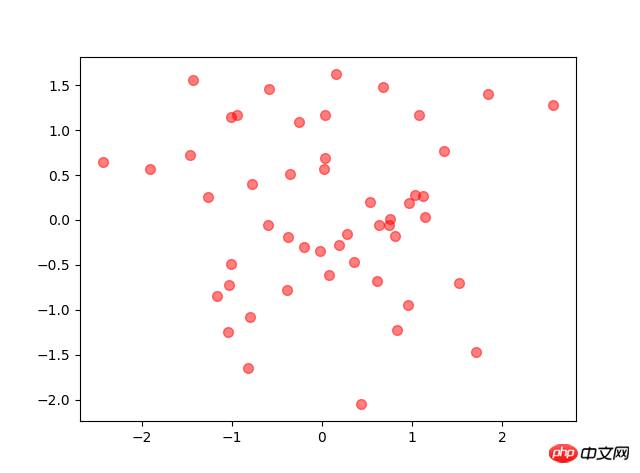
x x轴
y y轴
s   圆点面积
c   颜色
marker  圆点形状
alpha   圆点透明度                #其他图也类似这种配置
折れ線グラフはプロット関数を使用します
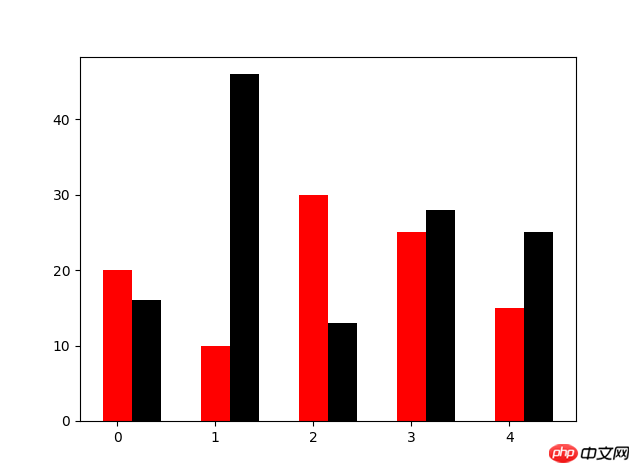
5.棒グラフ
N=50# height=np.random.randint(150,180,20)# weight=np.random.randint(80,150,20)
x=np.random.randn(N)
y=np.random.randn(N)
plt.scatter(x,y,s=50,c='r',marker='o',alpha=0.5)
plt.show()
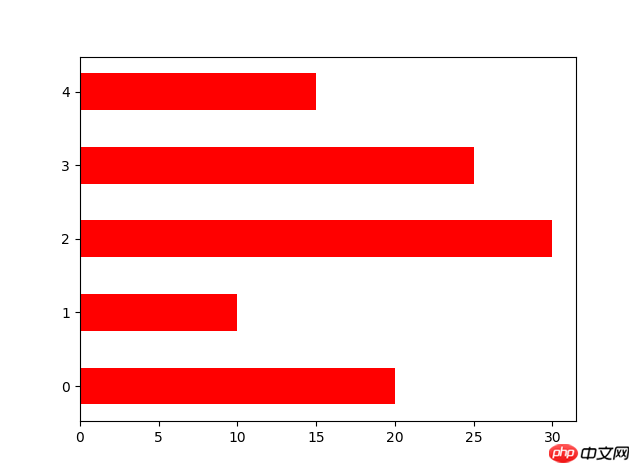
方向設定横棒グラフ
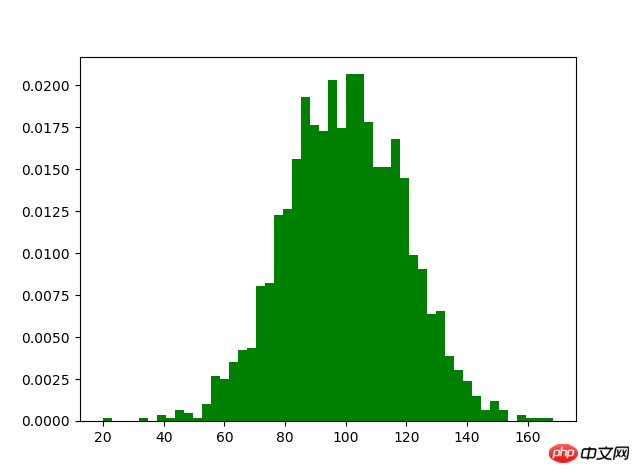
6. ヒストグラム
<code class="language-python hljs"># 来源:百度网盘搜索 <br/>x=np.linspace(<span class="hljs-number">-10000,<span class="hljs-number">10000,<span class="hljs-number">100) <span class="hljs-comment">#将-10到10等区间分成100份
y=x**<span class="hljs-number">2+x**<span class="hljs-number">3+x**<span class="hljs-number">7
plt.plot(x,y)
plt.show()</span></span></span></span></span></span></span></code>
N=5
y=[20,10,30,25,15]
y1=np.random.randint(10,50,5)
x=np.random.randint(10,1000,N)
index=np.arange(N)
plt.bar(left=index,height=y,color='red',width=0.3)
plt.bar(left=index+0.3,height=y1,color='black',width=0.3)
plt.show()
rree
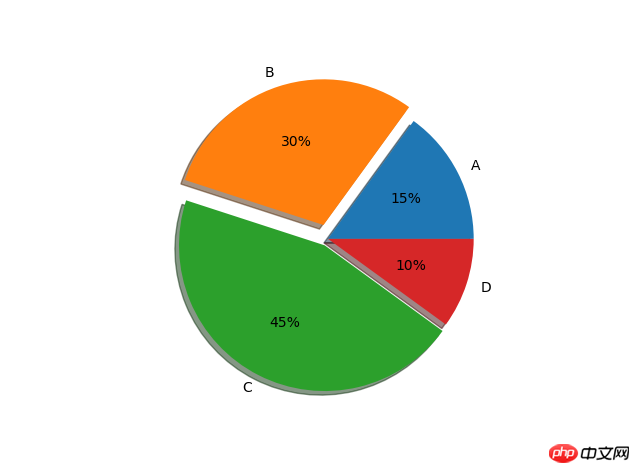
7.
リーリーアーリーアーリー
8.box写真を入力してください
N=5
y=[20,10,30,25,15]
y1=np.random.randint(10,50,5)
x=np.random.randint(10,1000,N)
index=np.arange(N)# plt.bar(left=index,height=y,color='red',width=0.3)# plt.bar(left=index+0.3,height=y1,color='black',width=0.3)#plt.barh() 加了h就是横向的条形图,不用设置orientation
plt.bar(left=0,bottom=index,width=y,color='red',height=0.5,orientation='horizontal')
plt.show()
rree
以上がPythonでグラフィックを描画する例を詳しく解説の詳細内容です。詳細については、PHP 中国語 Web サイトの他の関連記事を参照してください。
声明:
この記事の内容はネチズンが自主的に寄稿したものであり、著作権は原著者に帰属します。このサイトは、それに相当する法的責任を負いません。盗作または侵害の疑いのあるコンテンツを見つけた場合は、admin@php.cn までご連絡ください。