ホームページ >バックエンド開発 >Python チュートリアル >[Python-CVImage セグメンテーション : Canny Edges、Watershed、および K-Means メソッド]
[Python-CVImage セグメンテーション : Canny Edges、Watershed、および K-Means メソッド]
- Patricia Arquetteオリジナル
- 2024-12-11 05:33:09971ブラウズ
セグメンテーションは、オブジェクト、形状、または色に基づいて画像を意味のある部分に分割することを可能にする画像分析の基本的な手法です。これは、物体検出、コンピューター ビジョン、さらには芸術的な画像操作などのアプリケーションにおいて極めて重要な役割を果たします。しかし、セグメンテーションを効果的に達成するにはどうすればよいでしょうか?幸いなことに、OpenCV (cv2) は、セグメンテーションのためのユーザーフレンドリーで強力な方法をいくつか提供しています。
このチュートリアルでは、次の 3 つの一般的なセグメンテーション手法を検討します。
- Canny Edge Detection – オブジェクトの輪郭を描くのに最適です。
- Watershed アルゴリズム – 重なり合う領域を分離するのに最適です。
- K-Means カラー セグメンテーション – 画像内の類似した色のクラスタリングに最適です。
このチュートリアルを魅力的で実践的なものにするために、古代の古墳に焦点を当てた大阪の衛星画像と航空写真を使用します。これらのイメージと対応するサンプル ノートブックは、チュートリアルの GitHub ページからダウンロードできます。
Canny エッジ検出による輪郭セグメンテーション
Canny Edge Detection は、画像内のエッジを識別する簡単かつ強力な方法です。これは、オブジェクトの境界であることが多い、強度が急速に変化する領域を検出することによって機能します。この手法では、強度のしきい値を適用することで「細いエッジ」の輪郭を生成します。 OpenCV を使用した実装を見てみましょう。
例: 衛星画像内のエッジの検出
ここでは、大阪、特に古墳の衛星画像をテストケースとして使用します。
import cv2
import numpy as np
import matplotlib.pyplot as plt
files = sorted(glob("SAT*.png")) #Get png files
print(len(files))
img=cv2.imread(files[0])
use_image= img[0:600,700:1300]
gray = cv2.cvtColor(use_image, cv2.COLOR_BGR2GRAY)

#Stadard values
min_val = 100
max_val = 200
# Apply Canny Edge Detection
edges = cv2.Canny(gray, min_val, max_val)
#edges = cv2.Canny(gray, min_val, max_val,apertureSize=5,L2gradient = True )
False
# Show the result
plt.figure(figsize=(15, 5))
plt.subplot(131), plt.imshow(cv2.cvtColor(use_image, cv2.COLOR_BGR2RGB))
plt.title('Original Image'), plt.axis('off')
plt.subplot(132), plt.imshow(gray, cmap='gray')
plt.title('Grayscale Image'), plt.axis('off')
plt.subplot(133), plt.imshow(edges, cmap='gray')
plt.title('Canny Edges'), plt.axis('off')
plt.show()

出力エッジは、古墳の一部とその他の対象領域の輪郭を明確に示します。ただし、鋭いしきい値処理により一部の領域が失われます。結果は、min_val と max_val の選択、および画質に大きく依存します。
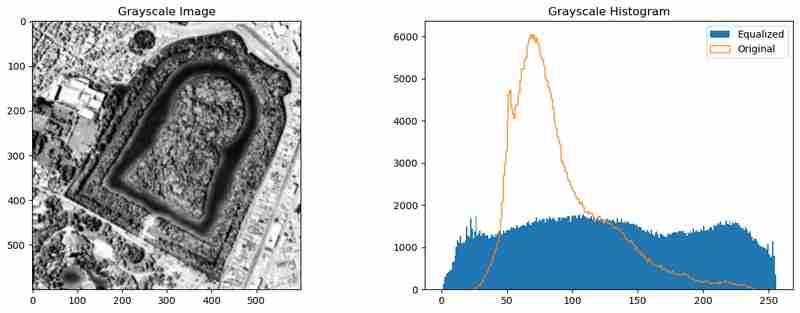
エッジ検出を強化するには、画像を前処理してピクセル強度を分散し、ノイズを低減します。これは、ヒストグラム等化 (cv2.equalizeHist()) とガウスぼかし (cv2.GaussianBlur()) を使用して実現できます。
use_image= img[0:600,700:1300]
gray = cv2.cvtColor(use_image, cv2.COLOR_BGR2GRAY)
gray_og = gray.copy()
gray = cv2.equalizeHist(gray)
gray = cv2.GaussianBlur(gray, (9, 9),1)

plt.figure(figsize=(15, 5))
plt.subplot(121), plt.imshow(gray, cmap='gray')
plt.title('Grayscale Image')
plt.subplot(122)
_= plt.hist(gray.ravel(), 256, [0,256],label="Equalized")
_ = plt.hist(gray_og.ravel(), 256, [0,256],label="Original",histtype='step')
plt.legend()
plt.title('Grayscale Histogram')

この前処理により、強度分布が均一になり、画像が滑らかになります。これにより、Canny Edge Detection アルゴリズムがより意味のあるエッジをキャプチャできるようになります。
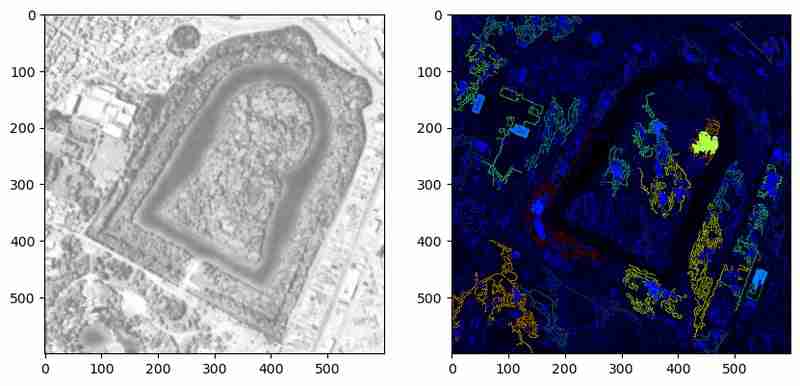
エッジは便利ですが、境界を示すだけです。囲まれた領域をセグメント化するには、エッジを等高線に変換し、視覚化します。
# Edges to contours
contours, hierarchy = cv2.findContours(edges, cv2.RETR_TREE, cv2.CHAIN_APPROX_SIMPLE)
# Calculate contour areas
areas = [cv2.contourArea(contour) for contour in contours]

# Normalize areas for the colormap
normalized_areas = np.array(areas)
if normalized_areas.max() > 0:
    normalized_areas = normalized_areas / normalized_areas.max()

# Create a colormap
cmap = plt.cm.jet

# Plot the contours with the color map
plt.figure(figsize=(10, 10))
plt.subplot(1,2,1)
plt.imshow(gray, cmap='gray', alpha=0.5)  # Display the grayscale image in the background
mask = np.zeros_like(use_image)
for contour, norm_area in zip(contours, normalized_areas):
    color = cmap(norm_area)  # Map the normalized area to a color
    color = [int(c*255) for c in color[:3]]
    cv2.drawContours(mask, [contour], -1, color,-1 )  # Draw contours on the image

plt.subplot(1,2,2)

上記の方法は、検出された輪郭をその相対的な領域を表す色で強調表示します。この視覚化は、等高線が閉じた体を形成しているのか、それとも単なる線を形成しているのかを確認するのに役立ちます。ただし、この例では、多くの等高線が閉じていないポリゴンのままです。さらに前処理やパラメータ調整を行うことで、これらの制限に対処できる可能性があります。
前処理と輪郭分析を組み合わせることで、Canny Edge Detection は画像内のオブジェクトの境界を識別するための強力なツールになります。ただし、オブジェクトが明確に定義され、ノイズが最小限に抑えられている場合に最も効果的に機能します。次に、K 平均法クラスタリングを検討して、画像を色ごとにセグメント化し、同じデータに対して異なる視点を提供します。
K平均クラスタリング
K-Means クラスタリングは、類似したアイテムをクラスターにグループ化するためのデータ サイエンスの一般的な方法であり、色の類似性に基づいて画像をセグメント化する場合に特に効果的です。 OpenCV の cv2.kmeans 関数はこのプロセスを簡素化し、オブジェクトのセグメンテーション、背景の削除、視覚分析などのタスクにアクセスできるようにします。
このセクションでは、K-Means クラスタリングを使用して、古墳画像を類似した色の領域にセグメント化します。
まず、画像の RGB 値に K-Means クラスタリングを適用し、各ピクセルをデータ ポイントとして扱います。
import cv2
import numpy as np
import matplotlib.pyplot as plt
files = sorted(glob("SAT*.png")) #Get png files
print(len(files))
img=cv2.imread(files[0])
use_image= img[0:600,700:1300]
gray = cv2.cvtColor(use_image, cv2.COLOR_BGR2GRAY)

#Stadard values
min_val = 100
max_val = 200
# Apply Canny Edge Detection
edges = cv2.Canny(gray, min_val, max_val)
#edges = cv2.Canny(gray, min_val, max_val,apertureSize=5,L2gradient = True )
False
# Show the result
plt.figure(figsize=(15, 5))
plt.subplot(131), plt.imshow(cv2.cvtColor(use_image, cv2.COLOR_BGR2RGB))
plt.title('Original Image'), plt.axis('off')
plt.subplot(132), plt.imshow(gray, cmap='gray')
plt.title('Grayscale Image'), plt.axis('off')
plt.subplot(133), plt.imshow(edges, cmap='gray')
plt.title('Canny Edges'), plt.axis('off')
plt.show()

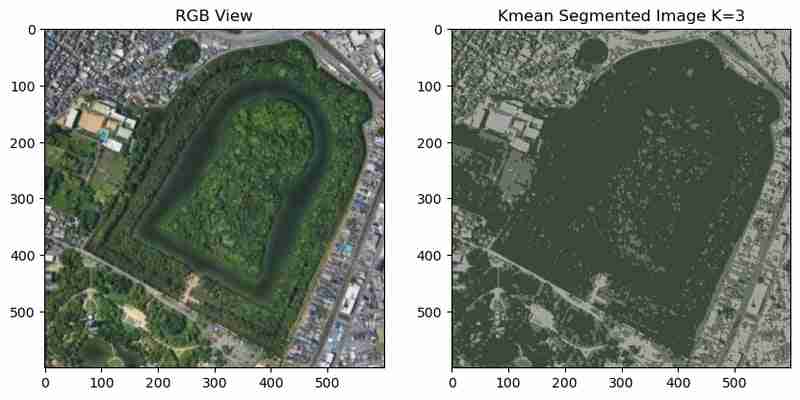
分割された画像では、古墳とその周囲の領域が個別の色でクラスター化されています。ただし、ノイズや色の小さな変化によりクラスターが断片化され、解釈が困難になる可能性があります。
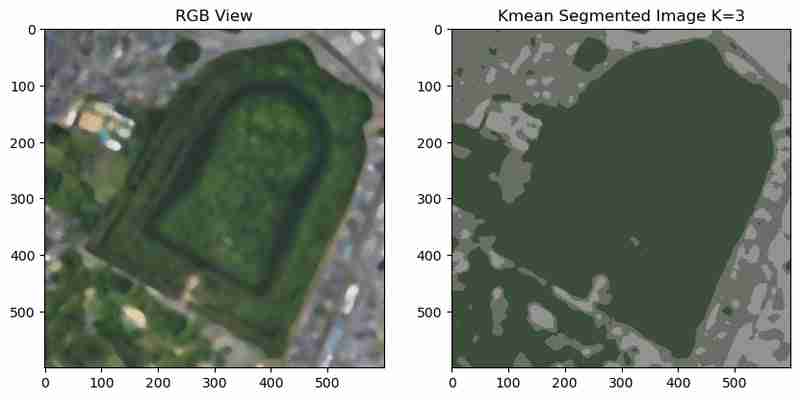
ノイズを低減し、より滑らかなクラスターを作成するには、K 平均法を実行する前に中央値ぼかしを適用できます。
use_image= img[0:600,700:1300]
gray = cv2.cvtColor(use_image, cv2.COLOR_BGR2GRAY)
gray_og = gray.copy()
gray = cv2.equalizeHist(gray)
gray = cv2.GaussianBlur(gray, (9, 9),1)

plt.figure(figsize=(15, 5))
plt.subplot(121), plt.imshow(gray, cmap='gray')
plt.title('Grayscale Image')
plt.subplot(122)
_= plt.hist(gray.ravel(), 256, [0,256],label="Equalized")
_ = plt.hist(gray_og.ravel(), 256, [0,256],label="Original",histtype='step')
plt.legend()
plt.title('Grayscale Histogram')

画像がぼやけると、クラスターがより滑らかになり、ノイズが減少し、セグメント化された領域が視覚的により一体になります。
セグメンテーションの結果をよりよく理解するために、matplotlib plt.fill_between;
を使用して、固有のクラスター色のカラー マップを作成できます。
# Edges to contours
contours, hierarchy = cv2.findContours(edges, cv2.RETR_TREE, cv2.CHAIN_APPROX_SIMPLE)
# Calculate contour areas
areas = [cv2.contourArea(contour) for contour in contours]

# Normalize areas for the colormap
normalized_areas = np.array(areas)
if normalized_areas.max() > 0:
    normalized_areas = normalized_areas / normalized_areas.max()

# Create a colormap
cmap = plt.cm.jet

# Plot the contours with the color map
plt.figure(figsize=(10, 10))
plt.subplot(1,2,1)
plt.imshow(gray, cmap='gray', alpha=0.5)  # Display the grayscale image in the background
mask = np.zeros_like(use_image)
for contour, norm_area in zip(contours, normalized_areas):
    color = cmap(norm_area)  # Map the normalized area to a color
    color = [int(c*255) for c in color[:3]]
    cv2.drawContours(mask, [contour], -1, color,-1 )  # Draw contours on the image

plt.subplot(1,2,2)

この視覚化により、画像内の主要な色とそれに対応する RGB 値についての洞察が得られ、さらなる分析に役立ちます。カラーコードをマスクして領域を選択できるようになりました。
クラスターの数 (K) は結果に大きな影響を与えます。 K を増やすとより詳細なセグメンテーションが作成され、値が低いとより広範なグループ化が作成されます。実験するには、複数の K 値を反復処理します。
import cv2
import numpy as np
import matplotlib.pyplot as plt
files = sorted(glob("SAT*.png")) #Get png files
print(len(files))
img=cv2.imread(files[0])
use_image= img[0:600,700:1300]
gray = cv2.cvtColor(use_image, cv2.COLOR_BGR2GRAY)

#Stadard values
min_val = 100
max_val = 200
# Apply Canny Edge Detection
edges = cv2.Canny(gray, min_val, max_val)
#edges = cv2.Canny(gray, min_val, max_val,apertureSize=5,L2gradient = True )
False
# Show the result
plt.figure(figsize=(15, 5))
plt.subplot(131), plt.imshow(cv2.cvtColor(use_image, cv2.COLOR_BGR2RGB))
plt.title('Original Image'), plt.axis('off')
plt.subplot(132), plt.imshow(gray, cmap='gray')
plt.title('Grayscale Image'), plt.axis('off')
plt.subplot(133), plt.imshow(edges, cmap='gray')
plt.title('Canny Edges'), plt.axis('off')
plt.show()

K のさまざまな値に対するクラスタリングの結果は、詳細と単純さの間のトレードオフを明らかにします。
・低い K 値 (例: 2-3): 明確な区別を持つ幅広いクラスターであり、高レベルのセグメンテーションに適しています。
・より高い K 値 (例: 12-15): より詳細なセグメンテーションですが、その代償として複雑さが増し、過剰セグメンテーションが発生する可能性があります。
K-Means クラスタリングは、色の類似性に基づいて画像をセグメント化するための強力な手法です。適切な前処理ステップを使用すると、明確で意味のある領域が生成されます。ただし、そのパフォーマンスは、K の選択、入力画像の品質、および適用される前処理によって異なります。次に、地形特徴を使用してオブジェクトと領域の正確なセグメンテーションを実現する Watershed アルゴリズムについて説明します。
流域のセグメンテーション
集水域アルゴリズムは、集水域が流域を分割する地形図からインスピレーションを得ています。この方法では、グレースケールの強度値を標高として扱い、効果的に「山」と「谷」を作成します。関心領域を識別することにより、アルゴリズムは正確な境界でオブジェクトをセグメント化できます。これは、重なり合うオブジェクトを分離するのに特に役立ち、細胞のセグメンテーション、オブジェクトの検出、密集したフィーチャの識別などの複雑なシナリオに最適です。
最初のステップは、特徴を強調するために画像を前処理し、次に Watershed アルゴリズムを適用することです。
use_image= img[0:600,700:1300]
gray = cv2.cvtColor(use_image, cv2.COLOR_BGR2GRAY)
gray_og = gray.copy()
gray = cv2.equalizeHist(gray)
gray = cv2.GaussianBlur(gray, (9, 9),1)

plt.figure(figsize=(15, 5))
plt.subplot(121), plt.imshow(gray, cmap='gray')
plt.title('Grayscale Image')
plt.subplot(122)
_= plt.hist(gray.ravel(), 256, [0,256],label="Equalized")
_ = plt.hist(gray_og.ravel(), 256, [0,256],label="Original",histtype='step')
plt.legend()
plt.title('Grayscale Histogram')
セグメント化された領域と境界は、中間処理ステップと一緒に視覚化できます。

# Edges to contours
contours, hierarchy = cv2.findContours(edges, cv2.RETR_TREE, cv2.CHAIN_APPROX_SIMPLE)
# Calculate contour areas
areas = [cv2.contourArea(contour) for contour in contours]

# Normalize areas for the colormap
normalized_areas = np.array(areas)
if normalized_areas.max() > 0:
    normalized_areas = normalized_areas / normalized_areas.max()

# Create a colormap
cmap = plt.cm.jet

# Plot the contours with the color map
plt.figure(figsize=(10, 10))
plt.subplot(1,2,1)
plt.imshow(gray, cmap='gray', alpha=0.5)  # Display the grayscale image in the background
mask = np.zeros_like(use_image)
for contour, norm_area in zip(contours, normalized_areas):
    color = cmap(norm_area)  # Map the normalized area to a color
    color = [int(c*255) for c in color[:3]]
    cv2.drawContours(mask, [contour], -1, color,-1 )  # Draw contours on the image

plt.subplot(1,2,2)
このアルゴリズムは、明確な領域を識別し、オブジェクトの周囲に明確な境界を描画します。この例では、古墳が正確に分割されています。ただし、アルゴリズムのパフォーマンスは、しきい値処理、ノイズ除去、形態学的演算などの前処理ステップに大きく依存します。
ヒストグラム均等化や適応ぼかしなどの高度な前処理を追加すると、結果をさらに向上させることができます。例:
# Kmean color segmentation
use_image= img[0:600,700:1300]
#use_image = cv2.medianBlur(use_image, 15)


 # Reshape image for k-means
pixel_values = use_image.reshape((-1, 3)) if len(use_image.shape) == 3 else use_image.reshape((-1, 1))
pixel_values = np.float32(pixel_values)

criteria = (cv2.TERM_CRITERIA_EPS + cv2.TERM_CRITERIA_MAX_ITER, 10, 1.0)
K = 3
attempts=10
ret,label,center=cv2.kmeans(pixel_values,K,None,criteria,attempts,cv2.KMEANS_PP_CENTERS)

centers = np.uint8(center)
segmented_data = centers[label.flatten()]
segmented_image = segmented_data.reshape(use_image.shape)

plt.figure(figsize=(10, 6))
plt.subplot(1,2,1),plt.imshow(use_image[:,:,::-1])
plt.title("RGB View")
plt.subplot(1,2,2),plt.imshow(segmented_image[:,:,[2,1,0]])
plt.title(f"Kmean Segmented Image K={K}")

これらの調整により、より多くの領域を正確にセグメント化でき、ノイズアーティファクトを最小限に抑えることができます。
ウォーターシェッド アルゴリズムは、正確な境界線の描写と重なり合うオブジェクトの分離が必要なシナリオに優れています。前処理技術を活用することで、古墳地域のような複雑な画像でも効果的に処理できます。ただし、その成功は慎重なパラメーターの調整と前処理にかかっています。
結論
セグメンテーションは画像分析に不可欠なツールであり、画像内の個別の要素を分離して理解するための経路を提供します。このチュートリアルでは、Canny Edge Detection、K-Means Clustering、および Watershed Algorithm という 3 つの強力なセグメンテーション手法を説明し、それぞれが特定のアプリケーションに合わせて調整されました。大阪の古墳の輪郭を描くことから、都市景観をクラスタ化し、異なる地域を分離することまで、これらの手法は、現実世界の課題に取り組む際の OpenCV の多用途性を強調しています。
次に、そこにあるメソッドの一部を選択したアプリケーションに適用し、コメントして結果を共有します。また、他の簡単なセグメンテーション方法を知っている場合は、それも共有してください
以上が[Python-CVImage セグメンテーション : Canny Edges、Watershed、および K-Means メソッド]の詳細内容です。詳細については、PHP 中国語 Web サイトの他の関連記事を参照してください。

