


-
ケニアのさまざまな都市の気象データの分析と予測
- はじめに
- データセットの概要
- 探索的データ分析
- 主要な気象特徴の視覚化
- 気象状況分析
- 都市別降雨量
- 月平均気温
- 月間平均降水量
- 気象変数間の相関関係
- ケーススタディ: 都市特有の傾向
- 結論
ケニアのさまざまな都市の気象データの分析と予測
導入
この記事では、Python を使用して天気パターンを分析する方法を説明します。気温傾向の特定から降水量の視覚化まで、このステップバイステップのガイドは、気象分析にデータ サイエンス技術を使用することに興味がある人に最適です。実用的な洞察を得るために、コード、データ操作、視覚化について調査します。
ケニアでは、天気は多くの分野、特に農業、観光、野外活動において重要な役割を果たしています。農家、企業、イベント プランナーは、意思決定を行うために正確な気象情報を必要としています。ただし、気象パターンは地域ごとに大きく異なる可能性があり、現在の予測システムでは常に局所的な洞察が得られるとは限りません。
このプロジェクトの目的は、ケニア全土のさまざまな地域の OpenWeatherMap API と Weather API からリアルタイムの気象データを収集することです。このデータはデータベースに保存され、Python を使用して分析され、次のような洞察が明らかになります。-
- 気温の傾向
- 降雨パターン - 湿度と風の状態
このプロジェクトでは、ケニアのさまざまな都市の気象情報を含むデータセットを分析します。データセットには、温度、湿度、気圧、風速、視程、降雨量などの要素を含む 3,000 行を超える気象観測結果が含まれています。これらの洞察を使用して、農業、観光、さらには管理などの天候に敏感なセクターにおける意思決定を支援できる、正確な地域固有の天気予報を提供することを目指しています。
データセットの概要
データセットはいくつかの列を使用して構造化されました:
- Datetime - 天気がいつ記録されたかを示すタイムスタンプ。
- 都市と国 - 気象観測の場所。
- 緯度と経度 - 場所の地理座標。
- 温度 (摂氏) - 記録された温度。
- 湿度 (%) - 空気中の湿度の割合。
- 圧力 (hPa) - ヘクトパスカル単位の大気圧。
- 風速 (m/s) - その時の風速。
- 雨 (mm) - ミリメートル単位で測定された降雨量。
- 雲 (%) - 雲の範囲の割合。
- 気象条件と天気の説明 - 天気の一般的および詳細な説明 (例: 「雲」、「散在雲」)。
これは、データベース内でデータがどのように構造化されているかです。
探索的データ分析
分析の最初のステップには、データの基本的な調査が含まれていました。
_ データ ディメンション - データセットには 3,000 行と 14 列が含まれています。
_ Null 値 - データの欠落が最小限に抑えられ、さらなる分析に対してデータセットの信頼性が保証されます。
print(df1[['temperature_celsius', 'humidity_pct', 'pressure_hpa', 'wind_speed_ms', 'rain', 'clouds']].describe())
上記のコードを使用して、温度、湿度、圧力、降雨量、雲の範囲、平均、広がりについての洞察を提供する数値列の要約統計量を計算しました。
主要な気象特徴の視覚化
気象の特徴をより明確に理解するために、さまざまな分布をプロットしました。
温度分布
sns.displot(df1['temperature_celsius'], bins=50, kde=True)
plt.title('Temperature Distribution')
plt.xlabel('Temperature (Celsius)')
この分布は、都市全体の気温の一般的な広がりを明らかにします。 KDE ライン プロットは、温度の確率分布を滑らかに推定します。
降水量分布
sns.displot(df1['rain'], bins=50, kde=True)
plt.title('Rainfall Distribution')
plt.xlabel('Rainfall (mm/h)')
このコードは、ケニアの都市全体の降雨分布を分析します。
湿度、気圧、風速
湿度 (%)、気圧 (hPa)、および 風速 (m/s) の同様の分布プロットは、それぞれについて有益な洞察を提供します。データセット全体にわたるこれらのパラメーターのバリエーション
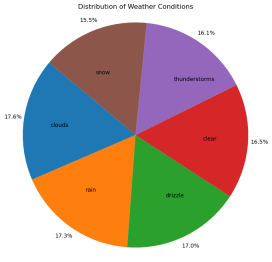
気象状況の分析
気象条件 (「雲」、「雨」など) がカウントされ、円グラフを使用して視覚化され、その比例分布が示されました。
condition_counts = df1['weather_condition'].value_counts()

plt.figure(figsize=(8,8))
plt.pie(condition_counts, labels=condition_counts.index, autopct='%1.1f%%', pctdistance=1.1, labeldistance=0.6, startangle=140)
plt.title('Distribution of Weather Conditions')
plt.axis('equal')
plt.show()
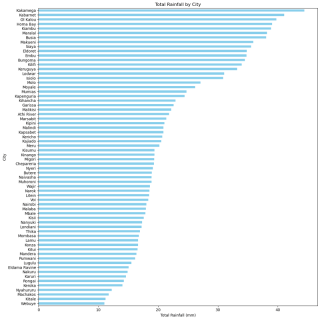
City-wise Rainfall
One of the key analysis was the total rainfall by city:
rainfall_by_city = df1.groupby('city')['rain'].sum().sort_values()

plt.figure(figsize=(12,12))
rainfall_by_city.plot(kind='barh', color='skyblue')
plt.title('Total Rainfall by City')
plt.xlabel('Total Rainfall (mm)')
plt.ylabel('City')
plt.tight_layout()
plt.show()
This bar plot highlighted which cities received the most rain over the observed period, with a few outliers showing significant rainfall compared to others.
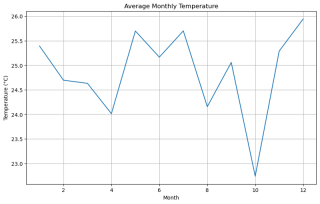
Average Monthly Temperature
avg_temp_by_month.plot(kind='line')
plt.title('Average Monthly Temperature')
The line chart revealed temperature fluctuations across different months, showing seasonal changes.
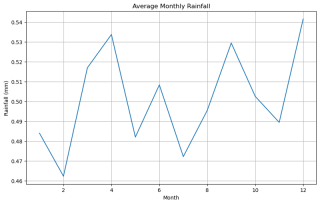
Average Monthly Rainfall
monthly_rain.plot(kind='line')
plt.title('Average Monthly Rainfall')
Similarly, rainfall was analyzed to observe how it varied month-to-month.
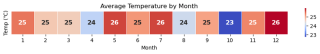
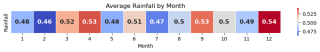
We also visualized the data using heatmaps for a more intuitive understanding of monthly temperature and rainfall.
Here are the heatmaps for the average monthly temperature and rainfall
Correlation Between Weather Variables
Next, I calculated the correlation matrix between key weather variables:
correlation_matrix = df1[['temperature_celsius', 'humidity_pct', 'pressure_hpa', 'wind_speed_ms', 'rain', 'clouds']].corr()
correlation_matrix
sns.heatmap(correlation_matrix, annot=True, cmap='coolwarm')
plt.title('Correlation Between Weather Variables')
This heatmap allowed us to identify relationships between variables. For example, we observed a negative correlation between temperature and humidity, as expected.
Case Study: City Specific Trends
I have focused on individual cities such as Mombasa and Nyeri, to explore their unique weather patterns:
Mombasa Temperature Trends
plt.plot(monthly_avg_temp_msa)
plt.title('Temperature Trends in Mombasa Over Time')
This city showed significant variation in temperature across the year.
Nyeri Rainfall Trends
plt.plot(monthly_avg_rain_nyr)
plt.title('Rainfall Trends in Nyeri Over Time')
The rainfall data for Nyeri displayed a clear seasonal pattern, with rainfall peaking during certain months.
Conclusion
This analysis provides a comprehensive overview of the weather conditions in major cities, highlighting the temperature, rainfall, and other key weather variables. By using visualizations like histograms, line charts, pie charts, and heatmaps, we were able to extract meaningful insights into the data. Further analysis could involve comparing these trends with historical weather patterns or exploring predictive modeling to forecast future weather trends.
You can find the Jupyter Notebook with the full code for this analysis in my GitHub repository).
以上がPython を使用した包括的な気象データ分析: 気温、降水量の傾向、視覚化の詳細内容です。詳細については、PHP 中国語 Web サイトの他の関連記事を参照してください。

 Python:編集と解釈に深く掘り下げますMay 12, 2025 am 12:14 AM
pythonusesahybridmodelofcompilation andtertation:1)thepythoninterpretercompilessourcodeodeplatform-indopent bytecode.2)thepythonvirtualmachine(pvm)thenexecuteTesthisbytecode、balancingeaseoputhswithporformance。
 Pythonは解釈されたものですか、それとも編集された言語であり、なぜそれが重要なのですか?May 12, 2025 am 12:09 AM
pythonisbothintersedand compiled.1)it'scompiledtobytecode forportabalityacrossplatforms.2)bytecodeisthenは解釈され、開発を許可します。
 ループ対pythonのループの場合:説明されたキーの違いMay 12, 2025 am 12:08 AM
loopsareideal whenyouwhenyouknumberofiterationsinadvance、foreleloopsarebetterforsituationsは、loopsaremoreedilaConditionismetを使用します
 ループのために:実用的なガイドMay 12, 2025 am 12:07 AM
henthenumber ofiterationsisknown advanceの場合、dopendonacondition.1)forloopsareideal foriterating over for -for -for -saredaverseversives likelistorarrays.2)whileopsaresupasiable forsaresutable forscenarioswheretheloopcontinupcontinuspificcond
 Python:それは本当に解釈されていますか?神話を暴くMay 12, 2025 am 12:05 AM
pythonisnotpurelyLepted; itusesahybridapproachofbytecodecodecodecodecodecodedruntimerttation.1)pythoncompilessourcodeintobytecode、whodythepythonvirtualmachine(pvm).2)
 同じ要素を持つPython ConcatenateリストMay 11, 2025 am 12:08 AM
ToconcatenateListsinpythothesheElements、使用:1)Operatortokeepduplicates、2)asettoremoveduplicates、or3)listcomplunting for controloverduplicates、各メトドハスディフェルフェルフェントパフォーマンスアンドソーダーインプリテーション。
 解釈対編集言語:Pythonの場所May 11, 2025 am 12:07 AM
pythonisantertedlanguage、useaseofuseandflexibility-butfactingporformantationationsincriticalapplications.1)解釈されたlikepythonexecuteline-by-lineを解釈します
 ループのために:Pythonでそれぞれを使用するのはいつですか?May 11, 2025 am 12:05 AM
Useforloopswhenthenumberofiterationsisknowninadvance、andwhiloopswheniterationsdependonacondition.1)forloopsareidealforsecenceslikelistoranges.2)


ホットAIツール

Undresser.AI Undress
リアルなヌード写真を作成する AI 搭載アプリ

AI Clothes Remover
写真から衣服を削除するオンライン AI ツール。

Undress AI Tool
脱衣画像を無料で

Clothoff.io
AI衣類リムーバー

Video Face Swap
完全無料の AI 顔交換ツールを使用して、あらゆるビデオの顔を簡単に交換できます。

人気の記事
ホットツール

MantisBT
Mantis は、製品の欠陥追跡を支援するために設計された、導入が簡単な Web ベースの欠陥追跡ツールです。 PHP、MySQL、Web サーバーが必要です。デモおよびホスティング サービスをチェックしてください。

SublimeText3 英語版
推奨: Win バージョン、コードプロンプトをサポート!

MinGW - Minimalist GNU for Windows
このプロジェクトは osdn.net/projects/mingw に移行中です。引き続きそこでフォローしていただけます。 MinGW: GNU Compiler Collection (GCC) のネイティブ Windows ポートであり、ネイティブ Windows アプリケーションを構築するための自由に配布可能なインポート ライブラリとヘッダー ファイルであり、C99 機能をサポートする MSVC ランタイムの拡張機能が含まれています。すべての MinGW ソフトウェアは 64 ビット Windows プラットフォームで実行できます。

DVWA
Damn Vulnerable Web App (DVWA) は、非常に脆弱な PHP/MySQL Web アプリケーションです。その主な目的は、セキュリティ専門家が法的環境でスキルとツールをテストするのに役立ち、Web 開発者が Web アプリケーションを保護するプロセスをより深く理解できるようにし、教師/生徒が教室環境で Web アプリケーションを教え/学習できるようにすることです。安全。 DVWA の目標は、シンプルでわかりやすいインターフェイスを通じて、さまざまな難易度で最も一般的な Web 脆弱性のいくつかを実践することです。このソフトウェアは、

EditPlus 中国語クラック版
サイズが小さく、構文の強調表示、コード プロンプト機能はサポートされていません

