


注: この投稿では、わかりやすくするためにグレースケール画像のみを使用します。
画像とは何ですか?
画像は値の行列として考えることができ、各値はピクセルの強度を表します。画像形式には主に 3 つのタイプがあります:
- バイナリ: この形式の画像は、0 (黒) と 1 (白) の値を持つ単一の 2 次元行列で表されます。これは画像表現の最も単純な形式です。
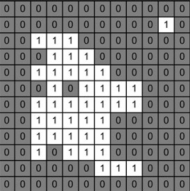
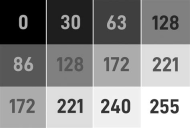
- グレースケール: この形式では、画像は 0 ~ 255 の範囲の値を持つ単一の 2 次元行列で表されます。ここで、0 は黒を表し、255 は白を表します。中間値は、さまざまなグレーの色合いを表します。
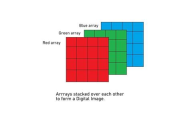
- RGB スケール: ここで、画像は 0 から 255 の範囲の値を持つ 3 つの 2 次元行列 (カラー チャネルごとに 1 つずつ、赤、緑、青) で表されます。各行列には、次のピクセル値が含まれています。 1 つのカラー コンポーネントであり、これら 3 つのチャネルを組み合わせるとフルカラー画像が得られます。
フィルター
フィルターは、特定の操作を適用して画像を変更するために使用されるツールです。フィルターは、画像上を移動するマトリックス (カーネルとも呼ばれます) であり、ウィンドウ内のピクセル値の計算を実行します。平均値フィルターと中央値フィルターという 2 つの一般的なタイプのフィルターについて説明します。
平均フィルター
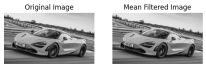
平均フィルターは、ウィンドウ内のピクセル値を平均化することでノイズを低減するために使用されます。ウィンドウ内の中心ピクセルを、そのウィンドウ内のすべてのピクセル値の平均に置き換えます。 cv2.blur() 関数は、カーネル サイズ 3x3 の平均フィルターを適用します。これは、平均を計算するために各ピクセルの周囲のピクセルの 3x3 ウィンドウを考慮することを意味します。これは画像を滑らかにするのに役立ちます。
import cv2
import matplotlib.pyplot as plt

image = cv2.imread('McLaren-720S-Price-1200x675.jpg', cv2.IMREAD_GRAYSCALE)

# Applies a Mean Filter of size 3 x 3
blurred_image = cv2.blur(image, (3, 3))

plt.subplot(1, 2, 1)
plt.imshow(image, cmap='gray')
plt.title('Original Image')
plt.axis("off")

plt.subplot(1, 2, 2)
plt.imshow(blurred_image, cmap='gray')
plt.title('Mean Filtered Image')
plt.axis("off")
plt.show()

メディアンフィルター
メディアン フィルターは、各ピクセルの値をウィンドウ内のすべてのピクセルの中央値で置き換えることによってノイズを低減するために使用されます。特にごま塩ノイズの除去に効果的です。 cv2.medianBlur() 関数は、カーネル サイズ 3 のメディアン フィルターを適用します。このメソッドは、各ピクセルをその近傍のピクセル値の中央値に置き換えます。これは、ノイズを除去しながらエッジを維持するのに役立ちます。ここで、カーネル サイズが大きいほど、画像はよりぼやけます。
import cv2
import matplotlib.pyplot as plt

image = cv2.imread('McLaren-720S-Price-1200x675.jpg', cv2.IMREAD_GRAYSCALE)

# Applies a Median Filter with a kernel size of 3
blurred_image = cv2.medianBlur(image, 3)

plt.subplot(1, 2, 1)
plt.imshow(image, cmap='gray')
plt.title('Original Image')
plt.axis("off")

plt.subplot(1, 2, 2)
plt.imshow(blurred_image, cmap='gray')
plt.title('Median Filtered Image')
plt.axis("off")
plt.show()
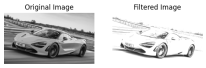
カスタムフィルター
カスタム フィルターを作成して、画像に特定の操作を適用できます。 cv2.filter2D() 関数を使用すると、任意のカスタム カーネルをイメージに適用できます。 cv2.filter2D() 関数は、カスタム カーネル (フィルター) をイメージに適用します。カーネルは、ピクセル値に対して実行される操作を定義する行列です。この例では、カーネルは指定された値に基づいて画像の特定の特徴を強化します。
import cv2
import numpy as np
import matplotlib.pyplot as plt

image = cv2.imread('McLaren-720S-Price-1200x675.jpg', cv2.IMREAD_GRAYSCALE)

# Define a custom filter kernel
kernel = np.array([[2, -1, 5],
                   [-5, 5, -1],
                   [0, -1, 0]])

filtered_image = cv2.filter2D(image, -1, kernel)

plt.subplot(1, 2, 1)
plt.imshow(image, cmap='gray')
plt.title('Original Image')
plt.axis('off')

plt.subplot(1, 2, 2)
plt.imshow(filtered_image, cmap='gray')
plt.title('Filtered Image')
plt.axis('off')

plt.show()
閾値処理
注: コード スニペットでは、しきい値処理されたイメージを割り当てるときに _ , image が表示されます。これは、 cv2.threshold 関数が、使用されたしきい値としきい値処理されたイメージの 2 つの値を返すためです。閾値処理された画像のみが必要なので、_ を使用して閾値を無視します。
閾値処理は、条件に基づいてピクセル値を設定することにより、画像を 2 値画像に変換します。しきい値処理手法にはいくつかの種類があります:
グローバルしきい値
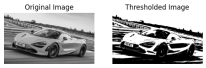
単純なしきい値処理
このメソッドは、画像全体に固定のしきい値を設定します。しきい値を超える値を持つピクセルは最大値 (255) に設定され、それ以下のピクセルは 0 に設定されます。 cv2.threshold() 関数は単純なしきい値処理に使用されます。強度が 127 より大きいピクセルは白 (255) に設定され、強度が 127 以下のピクセルは黒 (0) に設定され、バイナリ イメージが生成されます。
import cv2
import matplotlib.pyplot as plt

image = cv2.imread('McLaren-720S-Price-1200x675.jpg', cv2.IMREAD_GRAYSCALE)

_, thresholded_image = cv2.threshold(image, 127, 255, cv2.THRESH_BINARY)

plt.subplot(1, 2, 1)
plt.imshow(image, cmap='gray')
plt.title('Original Image')
plt.axis("off")

plt.subplot(1, 2, 2)
plt.imshow(thresholded_image, cmap='gray')
plt.title('Thresholded Image')
plt.axis("off")
plt.show()
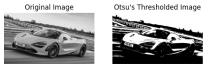
Otsu Thresholding
Otsu's method determines the optimal threshold value automatically based on the histogram of the image. This method minimizes intra-class variance and maximizes inter-class variance. By setting the threshold value to 0 and using cv2.THRESH_OTSU, the function automatically calculates the best threshold value to separate the foreground from the background.
import cv2
import matplotlib.pyplot as plt

image = cv2.imread('McLaren-720S-Price-1200x675.jpg', cv2.IMREAD_GRAYSCALE)

_, otsu_thresholded_image = cv2.threshold(image, 0, 255, cv2.THRESH_BINARY + cv2.THRESH_OTSU)

plt.subplot(1, 2, 1)
plt.imshow(image, cmap='gray')
plt.title('Original Image')
plt.axis("off")

plt.subplot(1, 2, 2)
plt.imshow(otsu_thresholded_image, cmap='gray')
plt.title("Otsu's Thresholded Image")
plt.axis("off")
plt.show()
Adaptive Thresholding
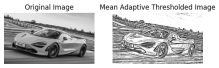
Mean Adaptive Thresholding
In Mean Adaptive Thresholding, the threshold value for each pixel is calculated based on the average of pixel values in a local neighborhood around that pixel. This method adjusts the threshold dynamically across different regions of the image. The cv2.adaptiveThreshold() function calculates the threshold for each pixel based on the mean value of the pixel values in a local 11x11 neighborhood. A constant value of 2 is subtracted from this mean to fine-tune the threshold. This method is effective for images with varying lighting conditions.
import cv2
import matplotlib.pyplot as plt

image = cv2.imread('McLaren-720S-Price-1200x675.jpg', cv2.IMREAD_GRAYSCALE)

mean_adaptive_thresholded_image = cv2.adaptiveThreshold(image, 255, cv2.ADAPTIVE_THRESH_MEAN_C, cv2.THRESH_BINARY, 11, 2)

plt.subplot(1, 2, 1)
plt.imshow(image, cmap='gray')
plt.title('Original Image')
plt.axis("off")

plt.subplot(1, 2, 2)
plt.imshow(mean_adaptive_thresholded_image, cmap='gray')
plt.title('Mean Adaptive Thresholded Image')
plt.axis("off")
plt.show()
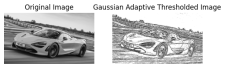
Gaussian Adaptive Thresholding
Gaussian Adaptive Thresholding computes the threshold value for each pixel based on a Gaussian-weighted sum of the pixel values in a local neighborhood. This method often provides better results in cases with non-uniform illumination. In Gaussian Adaptive Thresholding, the threshold is determined by a Gaussian-weighted sum of pixel values in an 11x11 neighborhood. The constant value 2 is subtracted from this weighted mean to adjust the threshold. This method is useful for handling images with varying lighting and shadows.
import cv2
import matplotlib.pyplot as plt

image = cv2.imread('McLaren-720S-Price-1200x675.jpg', cv2.IMREAD_GRAYSCALE)

gaussian_adaptive_thresholded_image = cv2.adaptiveThreshold(image, 255, cv2.ADAPTIVE_THRESH_GAUSSIAN_C, cv2.THRESH_BINARY, 11, 2)

plt.subplot(1, 2, 1)
plt.imshow(image, cmap='gray')
plt.title('Original Image')
plt.axis("off")

plt.subplot(1, 2, 2)
plt.imshow(gaussian_adaptive_thresholded_image, cmap='gray')
plt.title('Gaussian Adaptive Thresholded Image')
plt.axis("off")
plt.show()
References
- Encord.com
- Pyimagesearch.com
- OpenCV Thresholding
- OpenCV Filtering
以上がPython によるコンピューター ビジョンの概要 (パート 1)の詳細内容です。詳細については、PHP 中国語 Web サイトの他の関連記事を参照してください。

 LinuxターミナルでPythonバージョンを表示するときに発生する権限の問題を解決する方法は?Apr 01, 2025 pm 05:09 PM
LinuxターミナルでPythonバージョンを表示する際の許可の問題の解決策PythonターミナルでPythonバージョンを表示しようとするとき、Pythonを入力してください...
 HTMLを解析するために美しいスープを使用するにはどうすればよいですか?Mar 10, 2025 pm 06:54 PM
この記事では、Pythonライブラリである美しいスープを使用してHTMLを解析する方法について説明します。 find()、find_all()、select()、およびget_text()などの一般的な方法は、データ抽出、多様なHTML構造とエラーの処理、および代替案(SEL
 TensorflowまたはPytorchで深い学習を実行する方法は?Mar 10, 2025 pm 06:52 PM
この記事では、深い学習のためにTensorflowとPytorchを比較しています。 関連する手順、データの準備、モデルの構築、トレーニング、評価、展開について詳しく説明しています。 特に計算グラップに関して、フレームワーク間の重要な違い
 あるデータフレームの列全体を、Python内の異なる構造を持つ別のデータフレームに効率的にコピーする方法は?Apr 01, 2025 pm 11:15 PM
PythonのPandasライブラリを使用する場合、異なる構造を持つ2つのデータフレーム間で列全体をコピーする方法は一般的な問題です。 2つのデータがあるとします...
 人気のあるPythonライブラリとその用途は何ですか?Mar 21, 2025 pm 06:46 PM
この記事では、numpy、pandas、matplotlib、scikit-learn、tensorflow、django、flask、and requestsなどの人気のあるPythonライブラリについて説明し、科学的コンピューティング、データ分析、視覚化、機械学習、Web開発、Hの使用について説明します。
 Pythonでコマンドラインインターフェイス(CLI)を作成する方法は?Mar 10, 2025 pm 06:48 PM
この記事では、コマンドラインインターフェイス(CLI)の構築に関するPython開発者をガイドします。 Typer、Click、Argparseなどのライブラリを使用して、入力/出力の処理を強調し、CLIの使いやすさを改善するためのユーザーフレンドリーな設計パターンを促進することを詳述しています。
 Pythonの仮想環境の目的を説明してください。Mar 19, 2025 pm 02:27 PM
この記事では、Pythonにおける仮想環境の役割について説明し、プロジェクトの依存関係の管理と競合の回避に焦点を当てています。プロジェクト管理の改善と依存関係の問題を減らすための作成、アクティベーション、およびメリットを詳しく説明しています。
 正規表現とは何ですか?Mar 20, 2025 pm 06:25 PM
正規表現は、プログラミングにおけるパターンマッチングとテキスト操作のための強力なツールであり、さまざまなアプリケーションにわたるテキスト処理の効率を高めます。


ホットAIツール

Undresser.AI Undress
リアルなヌード写真を作成する AI 搭載アプリ

AI Clothes Remover
写真から衣服を削除するオンライン AI ツール。

Undress AI Tool
脱衣画像を無料で

Clothoff.io
AI衣類リムーバー

AI Hentai Generator
AIヘンタイを無料で生成します。

人気の記事
ホットツール

SublimeText3 Linux 新バージョン
SublimeText3 Linux 最新バージョン

PhpStorm Mac バージョン
最新(2018.2.1)のプロフェッショナル向けPHP統合開発ツール

AtomエディタMac版ダウンロード
最も人気のあるオープンソースエディター

SAP NetWeaver Server Adapter for Eclipse
Eclipse を SAP NetWeaver アプリケーション サーバーと統合します。

ゼンドスタジオ 13.0.1
強力な PHP 統合開発環境
ホットトピック
 7445
7445 15137252