
ホームページ >バックエンド開発 >Python チュートリアル >Python を使用してリアルタイム GitHub 統計ダッシュボードを構築する
Python を使用してリアルタイム GitHub 統計ダッシュボードを構築する

- 王林オリジナル
- 2024-08-27 06:04:06697ブラウズ
GitHub Firehose API を使用して、最もアクティブな GitHub ユーザーをリアルタイムで視覚化します
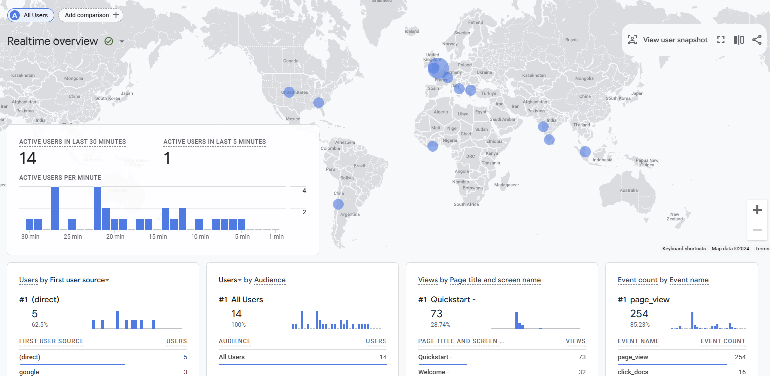
Google アナリティクスのリアルタイム ダッシュボードを試したことがありますか?人々があなたのウェブサイトをリアルタイムで操作しているのを見るのは、とても興味深いことです。 GitHub タイムライムを使用して同様のものを構築できることをご存知ですか?
Streamlit で基本的なプロトタイプを構築するのは驚くほど簡単です。非常に控えめで最小限の MVP バージョンのリアルタイム ダッシュボードを構築する方法を説明したいと思います。 GitHub イベントのパブリック ストリーム、つまり GitHub Firehose を使用できます。
これを使用して、GitHub ユーザー名ごとにイベント数を追跡し、現在のトップ 10 を表示する非常にシンプルなパイプラインとダッシュボードを構築できます。
これは、GithubFirehose API から取得したペイロードのプレビューです。このチュートリアルでは、そのほんの一部 (「アクター」オブジェクト) のみを使用します
{
    "id": "41339742815",
    "type": "WatchEvent",
    "actor": {
        "id": 12345678,
        "login": "someuser123",
        "display_login": "someuser123",
        "gravatar_id": "",
        "url": "https://api.github.com/users/someuser123",
        "avatar_url": "https://avatars.githubusercontent.com/u/12345678?",
    },
    "repo": {
        "id": 89012345,
        "name": "someorg/somerepo",
        "url": "https://api.github.com/repos/someorg/somerepo",
    },
    "payload": {
        "action": "started"
    },
    "public": true,
    "created_at": "2024-08-26T12:21:53Z"
}
しかし、単に Firehose を Streamlit に接続することはできません。最初にデータを処理するバックエンドが必要です。なぜ?
Streamlit でのリアルタイム データのレンダリングは困難な場合があります
Streamlit は、Python を使用してインタラクティブなアプリケーションのプロトタイプを迅速に作成するための素晴らしいツールです。ただし、リアルタイム データのレンダリングに関しては、Streamlit は少し難しい場合があります。 GitHub Firehose を Kafka にストリーミングするのは非常に簡単です (私の同僚の Kris Jenkins が、Python での High Performance Kafka プロデューサーと呼ばれるこれに関する優れたチュートリアルを提供しています)
しかし、Kafka から直接消費しているデータを Streamlit にレンダリングさせるのは、一種の煩雑な作業になる可能性があります。 Streamlit は、ミリ秒ごとに流れるデータの連続ストリームを処理するように設計されていません。いずれにしても、ビジュアライゼーションをその頻度で更新する必要はありません。
ソース データ ストリームがミリ秒ごとに更新される場合でも (非常にビジーなサーバー ログなど)、データのスナップショットを毎秒表示するだけで済みます。これを行うには、そのデータをデータベースにシンクし、Streamlit がより管理しやすいレートでポーリングできる API の背後に置きます。
データを API の背後に置くことで、Streamlit の処理が容易になるだけでなく、他のツールからデータにアクセスできるようになります。このアプローチにはバックエンドの開発が少し必要ですが、心配する必要はありません。 — ローカルで開始できるように、一連の Docker コンテナーと docker compose ファイルを用意しました。
バックエンドの全くの初心者であっても、これがどのように機能するかを理解できることをお約束します。
アーキテクチャ
使用するコンポーネントの概要を次に示します。
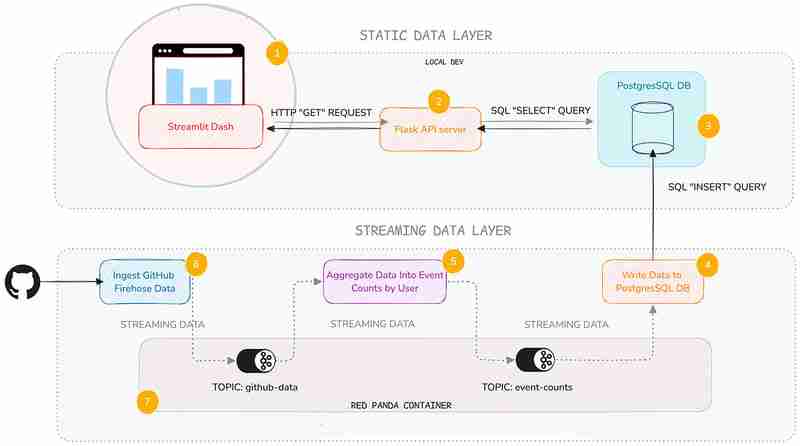
はい、たくさんあるように見えますが、静的データ層、つまり API サービスと Streamlit ダッシュボードに焦点を当てます。ここでは、ストリーミング データ レイヤーの曖昧な深さについては掘り下げません (ただし、さらに詳しく知りたい場合に備えて、いくつかのリンクを示します)。
このレイヤーを追加したのは、ストリーミング バックエンドを自分で保守する必要がない場合でも、ストリーミング バックエンドが一般的にどのように機能するかを知っておくと便利だからです。
各サービスの機能を簡単に説明します:
| Service | Description |
|---|---|
| Streamlit Service | Displays a Streamlit Dashboard which polls the API and renders the data in a chart and table. |
| Flask API | Serves a minimal REST API that can query a database and return the results as JSON. |
| Postgres Database | Stores the event count data. |
| Postgres Writer Service | Reads from a topic and continuously updates the database with new data. |
| Aggregation Service | Refines the raw event logs and continuously aggregates them into event counts broken down by GitHub display name. |
| Streaming Data Producer | Reads from a real-time public feed of activity on GitHub and streams the data to a topic in Redpanda (our local message broker). |
| Red Panda Server | Manages the flow of streaming data via topics (buffers for streaming data). |
You can inspect the code in the accompanying Github repo. Each service has its own subfolder, with code and a README:
Setting Up Your Environment
To get started, you’ll need Docker with Docker Compose installed (and Git of course). The easiest way is to install Docker Desktop. Once you have Docker set up, follow these steps:
1. Clone the repository:
git clone https://github.com/quixio/template-streamlit-rt-githubdash
2. Navigate to the repository:
cd template-streamlit-rt-githubdash
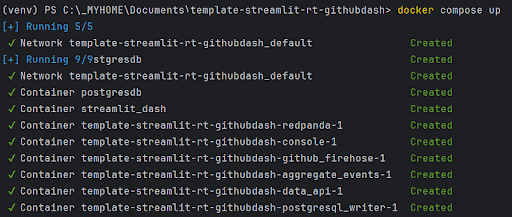
3. Spin up the Containers:
docker compose up
You should see some log entries that look like this (make sure Docker Desktop is running).
4. Visit the Streamlit URL
Open your browser and go to http://localhost:8031. You should see your dashboard running.
Code explanation
Let’s take a look at the two main components of the static data layer: the dashboard and the data API.
The Streamlit Dashboard
Now, let’s look at how the Streamlit app uses this API. It polls the API, gets the results back as JSON, turns the JSON into a dataframe, then caches the results. To refresh the results, the cache is cleared at a defined interval (currently 1 second) so that Streamlit needs to retrieve the data again.
import streamlit as st
import requests
import time
import pandas as pd
import os
import logging
from datetime import datetime
import plotly.express as px

from dotenv import load_dotenv
load_dotenv() ### for local dev, outside of docker, load env vars from a .env file

logging.basicConfig(level=logging.INFO)
logger = logging.getLogger(__name__)

# API endpoint URL
api_url = os.environ['API_URL']

## Function to get data from the API
def get_data():
   print(f"[{datetime.now()}] Fetching data from API...")
   response = requests.get(api_url)
   data = response.json()
   df = pd.DataFrame(data)

   try:
       # Reorder columns
       # df = df[['page_id', 'count']]
       df = df[['displayname', 'event_count']]
   except:
       logger.info("No data yet...")

   return df

# Function to get data and cache it
@st.cache_data
def get_cached_data():
   return get_data()

# Streamlit UI
st.title("Real-time Dashboard for GitHub Data using Streamlit,Flask and Quix")
st.markdown("This dashboard reads from a table via an API, which is being continuously updated by a Quix Streams sink process running in Docker. It then displays a dynamically updating Plotly chart and table underneath.")
st.markdown("In the backend, there are services that:\n * Read from the GitHub Firehose \n * Stream the event data to Redpanda\n * Read from Redpanda and aggregate the events per GitHub user\n * Sinking the page event counts (which are continuously updating) to PostGres\n\n ")
st.markdown("Take a closer a look at the [back-end code](https://github.com/quixio/template-streamlit-rt-githubdash), and learn how to read from a real-time source and apply some kind of transformation to the data before bringing it into Streamlit (using only Python)")

# Placeholder for the bar chart and table
chart_placeholder = st.empty()
table_placeholder = st.empty()

# Placeholder for countdown text
countdown_placeholder = st.empty()

# Main loop
while True:
   # Get the data
   df = get_cached_data()

   # Check that data is being retrieved and passed correctly
   if df.empty:
       st.error("No data found. Please check your data source.")
       break

   # Calculate dynamic min and max scales
   min_count = df['event_count'].min()
   max_count = df['event_count'].max()
   min_scale = min_count * 0.99
   max_scale = max_count * 1.01

   # Create a Plotly figure
   fig = px.bar(df, x='displayname', y='event_count', title="Current Top 10 active GitHub Users by event count",
                range_y=[min_scale, max_scale])

   # Style the chart
   fig.update_layout(
       xaxis_title="Display Name",
       yaxis_title="Event Count",
       xaxis=dict(tickangle=-90)  # Vertical label orientation
   )

   # Display the Plotly chart in Streamlit using st.plotly_chart
   chart_placeholder.plotly_chart(fig, use_container_width=True)

   # Display the dataframe as a table
   table_placeholder.table(df)

   # Countdown
   for i in range(1, 0, -1):
       countdown_placeholder.text(f"Refreshing in {i} seconds...")
       time.sleep(1)

   # Clear the countdown text
   countdown_placeholder.empty()

   # Clear the cache to fetch new data
   get_cached_data.clear()
This Streamlit app polls the API every second to fetch the latest data. It then displays this data in a dynamically updating bar chart and table. The @st.cache_data decorator is used to cache the data, reducing the load on the API.
The Data API
The API, built with Flask, serves as the gateway to our data. This code sets up a simple Flask API that queries a PostgreSQL database and returns the results as JSON. We’re using the psycopg2 library to interact with the database and Flask to define an API route.
import os
from flask import Flask, jsonify
from waitress import serve
import psycopg2
import logging

from dotenv import load_dotenv
load_dotenv() ### for local dev, outside of docker, load env vars from a .env file

logging.basicConfig(level=logging.INFO)
logger = logging.getLogger(__name__)

app = Flask(__name__)

# Replace with your PostgreSQL connection details
pg_host = os.environ['PG_HOST']
pg_port = os.getenv('PG_PORT','5432')
pg_db = os.environ['PG_DATABASE']
pg_user = os.environ['PG_USER']
pg_password = os.environ['PG_PASSWORD']
pg_table = os.environ['PG_TABLE']

# Establish a connection to PostgreSQL
conn = psycopg2.connect(
   host=pg_host,
   port=pg_port,
   database=pg_db,
   user=pg_user,
   password=pg_password
)

@app.route('/events', methods=['GET'])
def get_user_events():
   query = f"SELECT * FROM {pg_table} ORDER BY event_count DESC LIMIT 10"

   logger.info(f"Running query: {query}")

   try:
       # Execute the query
       with conn.cursor() as cursor:
           cursor.execute(query)
           results = cursor.fetchall()
           columns = [desc[0] for desc in cursor.description]

       # Convert the result to a list of dictionaries
       results_list = [dict(zip(columns, row)) for row in results]
   except:
       logger.info(f"Error querying Postgres...")
       results_list = [{"error": "Database probably not ready yet."}]

   return jsonify(results_list)

if __name__ == '__main__':
   serve(app, host="0.0.0.0", port=80)
You can set up a much fancier API with query parameters and whatnot, but here I want to keep it simple. When an API request is received, just select the top 10 entries from the event_counts table and returns them as JSON. That’s it.
Why Use an API?
You might wonder why we use an API instead of querying the database directly from Streamlit. Here are a few reasons:
- Decoupling: By separating the data access layer from the presentation layer, you can easily swap out or upgrade components without affecting the entire system.
- Scalability: An API can handle multiple clients and can be scaled independently of the Streamlit app.
- Reusability: Other applications or services can use the same API to access the data.
Actually, while we’re on the subject of APIs, it’s about time for a digression on why all this back end stuff is good to know in the first place.
An intro to Quix Streams — the library that powers the streaming data layer
I know I said I wasn’t going to talk too much about the streaming data layer, but I want to quickly show you how it works, because it’s really not as complicated as you might think.
It uses one Python library — Quix Streams — to produce to Redpanda (our Kafka stand-in), consume from it, then do our aggregations. If you know Pandas, you’ll quickly get the hang of it, because it uses the concept of “streaming data frames” to manipulate data.
Here are some code snippets that demonstrate the basics of Quix Streams.
Connecting to Kafka (or any other Kafka-compatible message broker) and initializing data source and destination.
# Initialize a connection by providing a broker address
app = Application(broker_address="localhost:19092") # This is a basic example, are many other optional arguments

# Define a topic to read from and/or to produce to
input_topic = app.topic("raw_data")
output_topic = app.topic("processed_data")

# turn the incoming data into a Streaming Dataframe
sdf = app.dataframe(input_topic)
All of the services in the streaming data layer (Streaming Data Producer, Aggregation service, and the Postgres Writer) use these basic conventions to interact with Redpanda.
The aggregation service uses the following code to manipulate the data on-the-fly.
sdf = app.dataframe(input_topic)

# Get just the "actor" data out of the larger JSON message and use it as the new streaming dataframe
sdf = sdf.apply(
   lambda data: {
       "displayname": data['actor']['display_login'],
       "id": data['actor']['id']
   }
)

# Group (aka "Re-key") the streaming data by displayname so we can count the events
sdf = sdf.group_by("displayname")

# Counts the number of events by displayname
def count_messages(value: dict, state: State):
   current_total = state.get('event_count', default=0)
   current_total += 1
   state.set('event_count', current_total)
   return current_total

# Adds the message key (displayname) to the message body too (not that necessary, it's just for convenience)
def add_key_to_payload(value, key, timestamp, headers):
   value['displayname'] = key
   return value

# Start manipulating the streaming dataframe
sdf["event_count"] = sdf.apply(count_messages, stateful=True) # Apply the count function and initialize a state store (acts as like mini database that lets us track the counts per displayname), then store the results in an "event_count" column

sdf = sdf[["event_count"]] # Cut down our streaming dataframe to be JUST the event_count column

sdf = sdf.apply(add_key_to_payload, metadata=True) # Add the message key "displayname" as a column so that its easier to see what user each event count belongs to.

sdf = sdf.filter(lambda row: row['displayname'] not in ['github-actions', 'direwolf-github', 'dependabot']) # Filter out what looks like bot accounts from the list of displaynames

sdf = sdf.update(lambda row: print(f"Received row: {row}")) # Print each row so that we can see what we're going to send to the downstream topic

# Produce our processed streaming dataframe to the downstream topic "event_counts"
sdf = sdf.to_topic(output_topic)
As you can see, it’s very similar to manipulating data in Pandas, it’s just that it’s data on-the-move, and we’re interacting with topics rather than databases or CSV files.
Running the Python files outside of Docker
With Docker, we’ve simplified the setup process, so you can see how the pipeline works straight away. But you can also tinker with the Python files outside of Docker.
In fact, I’ve included a stripped down docker-compose file ‘docker-compose-rp-pg.yaml’ with just the non-Python services included (it’s simpler to keep running the Repanda broker and the PostgreSQL DB in Docker).
That way, you can easily run Redpanda and Postgres while you tinker with the Python files.
docker-compose down
To continue working with the Python files outside of Docker:
- Create a fresh virtual environment.
- Install the requirements (this requirements file is at the root of the tutorial repo: *
pip install -r requirements.txt
- If your containers from the previous steps are still running, take them down with:.
docker-compose down
- Start the Redpanda and Postgres servers by running the “stripped down” docker compose file instead:
docker-compose -f docker-compose-rp-pg.yaml up
Now you’re ready to experiment with the Python files and run the code directly in an IDE such as PyCharm.
The next challenge
Here’s your next challenge. Why not update the services to create a real-time “trending repos” report by counting the most active repos in a 30-min time window?
You can use the Quix Streams Windowed Aggregations as a reference. After all, who wants to see the trending repos just for a whole day? Attention spans are getting shorter -and the world is going real-time — we need minute-by-minute updates! Life just feels more exciting when the numbers change before our eyes.
As a reminder, you can find all the code files in this repo: https://github.com/quixio/template-streamlit-rt-githubdash
Now, go forth and impress your colleagues with amazing real-time dashboards!
PS: If you run into trouble, feel free to drop me a line in the Quix Community slack channel and I’ll do my best to help.
以上がPython を使用してリアルタイム GitHub 統計ダッシュボードを構築するの詳細内容です。詳細については、PHP 中国語 Web サイトの他の関連記事を参照してください。