ホームページ >バックエンド開発 >Python チュートリアル >timeit.repeat - 繰り返しを試してパターンを理解する
timeit.repeat - 繰り返しを試してパターンを理解する
- 王林オリジナル
- 2024-08-09 07:25:021161ブラウズ
1. 問題
ソフトウェア エンジニアリングのキャリアの中で、許容範囲を超えて時間がかかる、パフォーマンスが低いコードに遭遇することがあります。さらに悪いことに、パフォーマンスは一貫性がなく、複数の実行にわたってかなり変動します。
現時点では、ソフトウェアのパフォーマンスに関しては、多くの非決定性が影響していることを受け入れる必要があるでしょう。データはウィンドウ内で分布することがあり、正規分布に従う場合もあります。また、明らかなパターンがなく不安定になる場合もあります。
2. アプローチ
これがベンチマークの出番です。コードを 5 回実行するのは良いことですが、最終的にはデータ ポイントが 5 つしかなく、各データ ポイントにあまりにも多くの値が設定されています。パターンを確認するには、同じコード ブロックをさらに多く繰り返す必要があります。
3. 質問
データ ポイントはいくつ必要ですか?それについては多くのことが書かれており、私が取り上げた論文の 1 つ
厳密なパフォーマンス評価にはベンチマークの構築が必要です。
ランダムに対処するために複数回実行および測定されます
実行時間の変動。研究者は対策を講じる必要があります
結果を報告する際の変動を考慮します。
カリベラ、T.、ジョーンズ、R. (2013)。妥当な時間内での厳密なベンチマーク。 2013 年メモリ管理国際シンポジウムの議事録。 https://doi.org/10.1145/2491894.2464160
パフォーマンスを測定する場合、パフォーマンスの全体像を把握するために、CPU、メモリ、またはディスクの使用量を測定することがあります。通常は、経過時間などの単純なものから始めるのが最適です。視覚化しやすいからです。 CPU 使用率が 17% であるということは、あまり意味がありません。それは何でしょうか? 20%か5? CPU 使用率は、人間がパフォーマンスを認識する自然な方法の 1 つではありません。
4. 実験
Python の timeit.repeat メソッドを使用して、単純なコード実行ブロックを繰り返します。コード ブロックは、1 から 2000 までの数値を乗算するだけです。
from functools import reduce
reduce((lambda x, y: x * y), range(1, 2000))
これはメソッドのシグネチャです
(function) def repeat(
    stmt: _Stmt = "pass",
    setup: _Stmt = "pass",
    timer: _Timer = ...,
    repeat: int = 5,
    number: int = 1000000,
    globals: dict[str, Any] | None = None
) -> list[float]
リピートとナンバーとは何ですか?
数字から始めましょう。コード ブロックが小さすぎると、コード ブロックがすぐに終了してしまい、何も測定できなくなります。この引数は、stmt を実行する必要がある回数を示します。これを新しいコード ブロックとみなすことができます。返される float は、stmt X 数値の実行時間のものです。
私たちの場合、2000 までの乗算はコストがかかるため、数値を 1000 のままにします。
次に、繰り返しに進みます。これは、上記のブロックを実行する必要がある繰り返しの回数または回数を指定します。 repeat が 5 の場合、list[float] は 5 つの要素を返します。
簡単な実行ブロックの作成から始めましょう
def run_experiment(number_of_repeats, number_of_runs=1000):
    execution_time = timeit.repeat(
        "from functools import reduce; reduce((lambda x, y: x * y), range(1, 2000))",
        repeat=number_of_repeats,
        number=number_of_runs
    )
    return execution_time
異なる繰り返し値で実行したい
repeat_values = [5, 20, 100, 500, 3000, 10000]
コードは非常にシンプルで簡単です
5. 結果の調査
ここで、実験の最も重要な部分、つまりデータの解釈に進みます。人によって解釈が異なる可能性があり、唯一の正解はないことにご注意ください。
正解の定義は、何を達成しようとしているかによって大きく異なります。ユーザーの 95% のパフォーマンスの低下を懸念していますか?それとも、非常に発言力の高いユーザーの 5% のテールのパフォーマンスの低下を心配していますか?
5.1.複数の繰り返し値の実行時間分析統計
ご覧のとおり、最小時間と最大時間は奇妙です。これは、平均値を変更するのに 1 つのデータポイントがどのように十分であるかを示しています。最悪の部分は、繰り返しの値が高い最小値と高い最大値が異なることです。相関関係はなく、外れ値の力を示すだけです。
次に中央値に移ります。繰り返しの数が増えるにつれて中央値が 20 を除いて下がっていることに気付きます。これは何が説明できるでしょうか?これは、繰り返しの数が少ないということは、必ずしも可能な値をすべて取得できるわけではないことを示しているだけです。
最低 2.5% と最高 2.5% が切り捨てられる切り捨て平均に移動します。これは、外れ値のユーザーを気にせず、中間の 95% のユーザーのパフォーマンスに焦点を当てたい場合に便利です。
中間の 95% のユーザーのパフォーマンスを向上させようとすると、外れ値の 5% のユーザーのパフォーマンスが低下する可能性があることに注意してください。

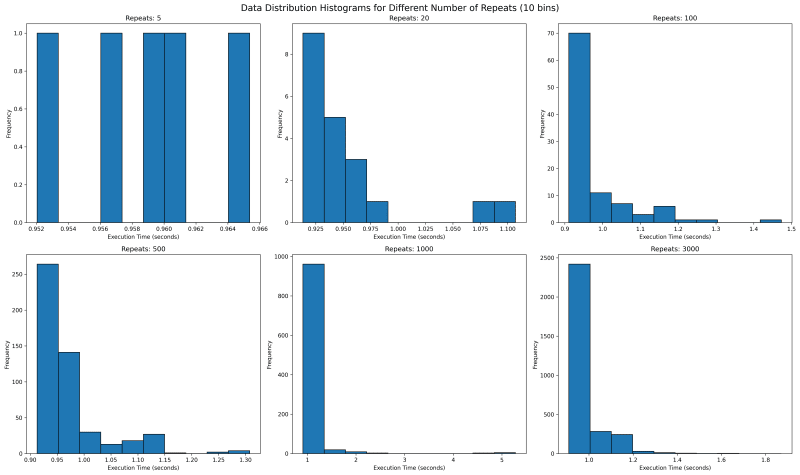
5.2. Execution Time Distribution for multiple values of repeat
Next we want to see where all the data lies. We would use histogram with bin of 10 to see where the data falls. With repetitions of 5 we see that they are mostly equally spaced. This is not one usually expects as sampled data should follow a normal looking distribution.
In our case the value is bounded on the lower side and unbounded on the upper side, since it will take more than 0 seconds to run any code, but there is no upper time limit. This means our distribution should look like a normal distribution with a long right tail.
Going forward with higher values of repeat, we see a tail emerging on the right. I would expect with higher number of repeat, there would be a single histogram bar, which is tall enough that outliers are overshadowed.

5.3. Execution Time Distribution for values 1000 and 3000
How about we look at larger values of repeat to get a sense? We see something unusual. With 1000 repeats, there are a lot of outliers past 1.8 and it looks a lot more tighter. The one on the right with 3000 repeat only goes upto 1.8 and has most of its data clustered around two peaks.
What can it mean? It can mean a lot of things including the fact that sometimes maybe the data gets cached and at times it does not. It can point to many other side effects of your code, which you might have never thought of. With the kind of distribution of both 1000 and 3000 repeats, I feel the TM95 for 3000 repeat is the most accurate value.

6. Appendix
6.1. Code
import timeit
import matplotlib.pyplot as plt
import json
import os
import statistics
import numpy as np

def run_experiment(number_of_repeats, number_of_runs=1000):
    execution_time = timeit.repeat(
        "from functools import reduce; reduce((lambda x, y: x * y), range(1, 2000))",
        repeat=number_of_repeats,
        number=number_of_runs
    )
    return execution_time

def save_result(result, repeats):
    filename = f'execution_time_results_{repeats}.json'
    with open(filename, 'w') as f:
        json.dump(result, f)

def load_result(repeats):
    filename = f'execution_time_results_{repeats}.json'
    if os.path.exists(filename):
        with open(filename, 'r') as f:
            return json.load(f)
    return None

def truncated_mean(data, percentile=95):
    data = np.array(data)
    lower_bound = np.percentile(data, (100 - percentile) / 2)
    upper_bound = np.percentile(data, 100 - (100 - percentile) / 2)
    return np.mean(data[(data >= lower_bound) & (data <= upper_bound)])

# List of number_of_repeats to test
repeat_values = [5, 20, 100, 500, 1000, 3000]

# Run experiments and collect results
results = []
for repeats in repeat_values:
    result = load_result(repeats)
    if result is None:
        print(f"Running experiment for {repeats} repeats...")
        try:
            result = run_experiment(repeats)
            save_result(result, repeats)
            print(f"Experiment for {repeats} repeats completed and saved.")
        except KeyboardInterrupt:
            print(f"\nExperiment for {repeats} repeats interrupted.")
            continue
    else:
        print(f"Loaded existing results for {repeats} repeats.")

    # Print time taken per repetition
    avg_time = statistics.mean(result)
    print(f"Average time per repetition for {repeats} repeats: {avg_time:.6f} seconds")

    results.append(result)

trunc_means = [truncated_mean(r) for r in results]
medians = [np.median(r) for r in results]
mins = [np.min(r) for r in results]
maxs = [np.max(r) for r in results]

# Create subplots
fig, axs = plt.subplots(2, 2, figsize=(15, 12))
fig.suptitle('Execution Time Analysis for Different Number of Repeats', fontsize=16)

metrics = [
    ('Truncated Mean (95%)', trunc_means),
    ('Median', medians),
    ('Min', mins),
    ('Max', maxs)
]

for (title, data), ax in zip(metrics, axs.flatten()):
    ax.plot(repeat_values, data, marker='o')
    ax.set_title(title)
    ax.set_xlabel('Number of Repeats')
    ax.set_ylabel('Execution Time (seconds)')
    ax.set_xscale('log')
    ax.grid(True, which="both", ls="-", alpha=0.2)

    # Set x-ticks and labels for each data point
    ax.set_xticks(repeat_values)
    ax.set_xticklabels(repeat_values)

    # Rotate x-axis labels for better readability
    ax.tick_params(axis='x', rotation=45)

plt.tight_layout()

# Save the plot to a file
plt.savefig('execution_time_analysis.png', dpi=300, bbox_inches='tight')
print("Plot saved as 'execution_time_analysis.png'")

# Create histograms for data distribution with 10 bins
fig, axs = plt.subplots(2, 3, figsize=(20, 12))
fig.suptitle('Data Distribution Histograms for Different Number of Repeats (10 bins)', fontsize=16)

for repeat, result, ax in zip(repeat_values, results, axs.flatten()):
    ax.hist(result, bins=10, edgecolor='black')
    ax.set_title(f'Repeats: {repeat}')
    ax.set_xlabel('Execution Time (seconds)')
    ax.set_ylabel('Frequency')

plt.tight_layout()

# Save the histograms to a file
plt.savefig('data_distribution_histograms_10bins.png', dpi=300, bbox_inches='tight')
print("Histograms saved as 'data_distribution_histograms_10bins.png'")

# Create histograms for 1000 and 3000 repeats with 30 bins
fig, axs = plt.subplots(1, 2, figsize=(15, 6))
fig.suptitle('Data Distribution Histograms for 1000 and 3000 Repeats (30 bins)', fontsize=16)

for repeat, result, ax in zip([1000, 3000], results[-2:], axs):
    ax.hist(result, bins=100, edgecolor='black')
    ax.set_title(f'Repeats: {repeat}')
    ax.set_xlabel('Execution Time (seconds)')
    ax.set_ylabel('Frequency')

plt.tight_layout()

# Save the detailed histograms to a file
plt.savefig('data_distribution_histograms_detailed.png', dpi=300, bbox_inches='tight')
print("Detailed histograms saved as 'data_distribution_histograms_detailed.png'")

plt.show()
以上がtimeit.repeat - 繰り返しを試してパターンを理解するの詳細内容です。詳細については、PHP 中国語 Web サイトの他の関連記事を参照してください。

