Maison >développement back-end >Tutoriel Python >Comment utiliser le framework de visualisation Python
Comment utiliser le framework de visualisation Python
- 王林avant
- 2023-05-09 12:07:072721parcourir
1. Introduction
Plotly est un framework de visualisation de données open source très célèbre et puissant. Il affiche des informations en créant des graphiques interactifs basés sur l'affichage du navigateur sous forme Web et peut créer des dizaines de graphiques et de cartes exquis.
2. Règles de grammaire du dessin
2.1 Méthode de dessin hors ligne
Il existe deux façons de dessiner des images dans Plotly, en ligne et hors ligne, car le dessin en ligne nécessite de créer un compte pour obtenir une clé API, ce qui est plus gênant, donc cet article présente uniquement le dessin hors ligne.
Il existe deux méthodes pour dessiner hors ligne : plotly.offline.plot() et plotly.offline.iplot(). La première génère un fichier image au format html dans le répertoire de travail actuel de manière hors ligne et l'ouvre automatiquement ;
Cette dernière est une méthode dédiée dans le notebook jupyter, qui consiste à intégrer les graphiques générés dans le fichier ipynb. Cet article utilise cette dernière méthode (notez que lorsque vous utilisez plotly.offline.iplot() dans le notebook jupyter, vous devez le faire. exécutez-le avant plotly.offline.init_notebook_mode() pour terminer l'initialisation du code de dessin, sinon une erreur sera signalée). Les principaux paramètres de
plotly.offline.iplot() sont les suivants :
-
figure_or_data : passé dans plotly.graph_objs.Figure, plotly.graph_objs.Data, dictionnaire ou liste, qui peut décrire les données de un graphique
show_link : type bool, utilisé pour ajuster si l'image de sortie a une marque de tracé dans le coin inférieur droit
link_text : entrée de type str, utilisée pour définir le contenu du texte de description dans le coin inférieur droit de l'image (lorsque show_link=True ), la valeur par défaut est 'Export to plot.ly'
image : str type ou None, contrôle le format de téléchargement de l'image générée, y compris 'png', 'jpeg', 'svg', 'webp', la valeur par défaut est None , c'est-à-dire que la méthode de téléchargement ne sera pas définie pour l'image générée
filename : type str, contrôle le nom de fichier de l'image enregistrée, la valeur par défaut est ' plot'
image_height : type int, contrôle la valeur en pixels de la hauteur de l'image, la valeur par défaut est 600
image_width : type int, la valeur en pixels qui contrôle la largeur de l'image, la valeur par défaut est 800
Ce qui suit est un exemple simple :
import plotly
import plotly.graph_objs as go
'''初始化jupyter notebook中的绘图模式'''
plotly.offline.init_notebook_mode()
'''绘制一个基本的折线图,控制其尺寸为1600x600'''
plotly.offline.iplot([{'x': [1, 2, 3], 'y': [5, 2, 7]}],
 image_height=600,
 image_width=1600)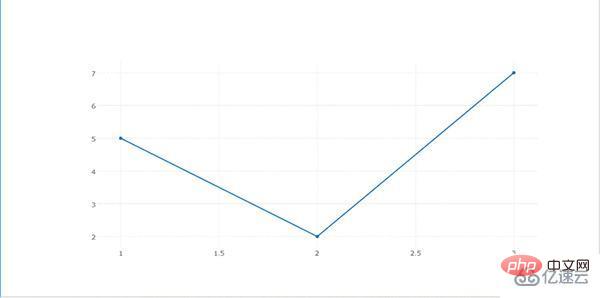
2.2 objet graphique
plotly graph_objs est un sous-module sous plotly, utilisé pour importer tous les objets graphiques dans plotly. Après avoir importé les objets graphiques correspondants, vous pouvez. définissez un objet graphique en fonction des données qui doivent être présentées et des paramètres de spécification graphique personnalisés, puis saisissez-le dans plotly. La présentation finale est effectuée dans
Recherchez le manuel d'aide correspondant et obtenez. les résultats suivants :
Help on package plotly.graph_objs in plotly:
NAME
 plotly.graph_objs
DESCRIPTION
 graph_objs
 ==========
 This package imports definitions for all of Plotly's graph objects. For more
 information, run help(Obj) on any of the following objects defined here.
 The reason for the package graph_objs and the module graph_objs is to provide
 a clearer API for users.
PACKAGE CONTENTS
 _area
 _bar
 _box
 _candlestick
 _carpet
 _choropleth
 _cone
 _contour
 _contourcarpet
 _deprecations
 _figure
 _figurewidget
 _frame
 _heatmap
 _heatmapgl
 _histogram
 _histogram2d
 _histogram2dcontour
 _layout
 _mesh4d
 _ohlc
 _parcoords
 _pie
 _pointcloud
 _sankey
 _scatter
 _scatter3d
 _scattercarpet
 _scattergeo
 _scattergl
 _scattermapbox
 _scatterpolar
 _scatterpolargl
 _scatterternary
 _splom
 _surface
 _table
 _violin
 area (package)
 bar (package)
 box (package)
 candlestick (package)
 carpet (package)
 choropleth (package)
 cone (package)
 contour (package)
 contourcarpet (package)
 graph_objs
 graph_objs_tools
 heatmap (package)
 heatmapgl (package)
 histogram (package)
 histogram2d (package)
 histogram2dcontour (package)
 layout (package)
 mesh4d (package)
 ohlc (package)
 parcoords (package)
 pie (package)
 pointcloud (package)
 sankey (package)
 scatter (package)
 scatter3d (package)
 scattercarpet (package)
 scattergeo (package)
 scattergl (package)
 scattermapbox (package)
 scatterpolar (package)
 scatterpolargl (package)
 scatterternary (package)
 splom (package)
 surface (package)
 table (package)
 violin (package)
DATA
 absolute_import = _Feature((2, 5, 0, 'alpha', 1), (3, 0, 0, 'alpha', 0...
FILE
 d:anacondalibsite-packagesplotlygraph_objs__init__.py
On peut voir que graph_objs contient un ensemble très riche d'objets graphiques. Cet article sélectionnera également certains des objets couramment utilisés à introduire.
2.3 Construire des traces
Après avoir importé l'obj correspondant à partir de graph_objs selon les exigences du dessin, la prochaine chose à faire est de configurer les paramètres pertinents pour l'obj spécifié en fonction des données à afficher, ce qui est appelé construction en traces de tracé (créer des traces), voici deux exemples simples pour aider à comprendre cette partie :
Tout d'abord, dessinons un nuage de points plus basique :
import plotly
import plotly.graph_objs as go
import numpy as np
'''构造1000个服从二维正态分布的模拟数据'''
N = 1000
random_x = np.random.randn(N)
random_y = np.random.randn(N)
'''构造trace,配置相关参数'''
trace = go.Scatter(
 x = random_x,
 y = random_y,
 mode = 'markers'
)
'''将trace保存于列表之中'''
data = [trace]
'''启动绘图'''
plotly.offline.init_notebook_mode()
plotly.offline.iplot(data, filename='basic-scatter')
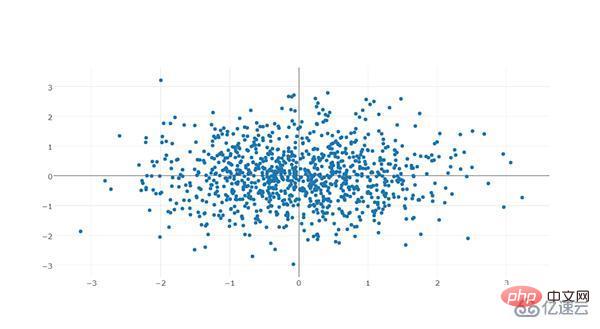
Comme le montre l'exemple simple ci-dessus, tracez La méthode générale de création, et plusieurs traces peuvent être superposées sur un même graphique, comme le montre l'exemple suivant :
import numpy as np
import plotly
import plotly.graph_objs as go
'''创建仿真数据'''
N = 100
random_x = np.linspace(0, 1, N)
random_y0 = np.random.randn(N)+5
random_y1 = np.random.randn(N)
random_y2 = np.random.randn(N)-5
'''构造trace0'''
trace0 = go.Scatter(
 x = random_x,
 y = random_y0,
 mode = 'markers',
 name = 'markers'
)
'''构造trace1'''
trace1 = go.Scatter(
 x = random_x,
 y = random_y1,
 mode = 'lines+markers',
 name = 'lines+markers'
)
'''构造trace2'''
trace2 = go.Scatter(
 x = random_x,
 y = random_y2,
 mode = 'lines',
 name = 'lines'
)
'''将所有trace保存在列表中'''
data = [trace0, trace1, trace2]
'''启动绘图'''
plotly.offline.init_notebook_mode()
plotly.offline.iplot(data, filename='scatter-mode')
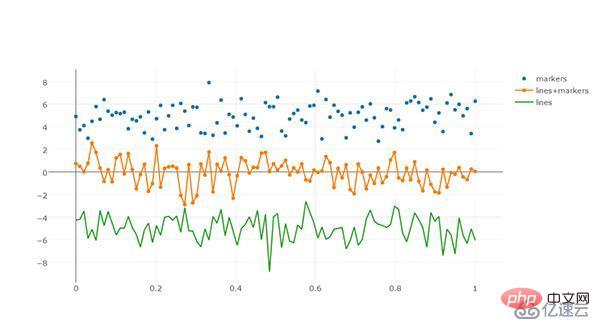
Pour différents graph_obj, le format de configuration des traces est également différent.
2.4 Définir la mise en page
Les éléments du calque de l'image dans plotly sont indépendants de l'arrière-plan sous-jacent, des axes de coordonnées, etc. Après avoir défini les objets nécessaires pour dessiner l'image à travers le contenu introduit précédemment, nous pouvons la dessiner directement , mais si vous souhaitez avoir un contenu plus personnalisé sur le calque d'arrière-plan, vous devez définir un objet Layout(). Ses principaux paramètres sont les suivants. Nous le divisons en plusieurs parties en fonction des différents objets de configuration et les expliquons séparément avec des exemples. :
2.4.1 Texte
Le texte est une partie très importante d'une image. Le puissant mécanisme de dessin de Plotly divise soigneusement le texte dans une image et peut être très ciblé sur un certain composant. paramètres personnalisés pour certaines polices :
Texte global :
font : Type de police, utilisé pour contrôler la partie police globale de l'image. Ses touches et fonctions communes sont les suivantes :
family : type str , utilisé pour contrôler les polices, la valeur par défaut est 'Open Sans', les options sont 'verdana', 'arial', 'sans-serif', etc., veuillez vous référer à la documentation officielle du site Web pour plus de détails
taille : type int, utiliser pour contrôler la taille de la police, la valeur par défaut est 12
color: type str, saisissez la couleur hexadécimale, la valeur par défaut est '#444'
Voici un exemple simple :
import plotly
import plotly.graph_objs as go
import numpy as np
'''构造1000个服从二维正态分布的模拟数据'''
N = 1000
random_x = np.random.randn(N)
random_y = np.random.randn(N)
'''构造trace,配置相关参数'''
trace = go.Scatter(
 x = random_x,
 y = random_y,
 mode = 'markers'
)
'''将trace保存于列表之中'''
data = [trace]
'''创建layout对象'''
layout = go.Layout(title='测试',
 font={
 'size':22,
 'family':'sans-serif',
 'color':'9ed900'#将全局字体颜色设置颜色为葱绿
 })
'''将graph部分和layout部分组合成figure对象'''
fig = go.Figure(data=data, layout=layout)
'''启动绘图直接绘制figure对象'''
plotly.offline.init_notebook_mode()
plotly.offline.iplot(fig,filename='basic-scatter')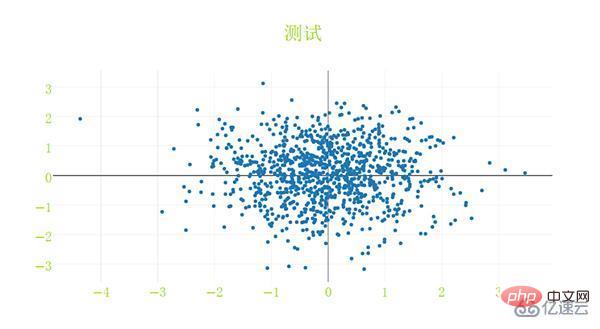
标题文字:
title:str型,用于控制图像的主标题
titlefont:字典型,用于独立控制标题字体的部分,其常用键如下:
family:同font中的family,用于单独控制标题字体
size:int型,控制标题的字体大小
color:同font中的color
下面是一个简单的例子:
import plotly
import plotly.graph_objs as go
import numpy as np
'''构造1000个服从二维正态分布的模拟数据'''
N = 1000
random_x = np.random.randn(N)
random_y = np.random.randn(N)
'''构造trace,配置相关参数'''
trace = go.Scatter(
x = random_x,
y = random_y,
mode = 'markers'
)
'''将trace保存于列表之中'''
data = [trace]
'''创建layout对象'''
layout = go.Layout(title='测试',
titlefont={
'size':20,
'color':'9ed900'#将标题字体颜色设置颜色为葱绿
})
'''将graph部分和layout部分组合成figure对象'''
fig = go.Figure(data=data, layout=layout)
'''启动绘图直接绘制figure对象'''
plotly.offline.init_notebook_mode()
plotly.offline.iplot(fig,filename='basic-scatter')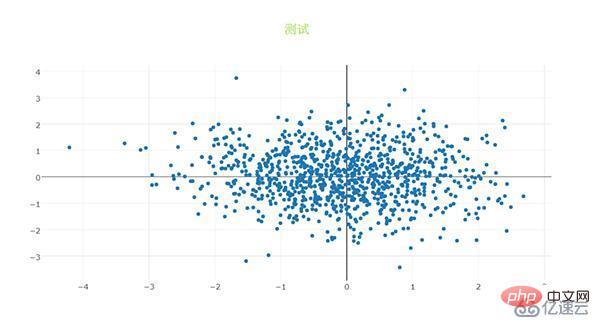
2.4.2 坐标轴
xaxis或yaxis:字典型,控制横坐标的各属性,其主要键如下:
color:str型,传入十六进制色彩,控制横坐标上所有元素的基础颜色(在未单独指定颜色之前,这些元素均采用此处color指定的颜色)
title:str型,设置横坐标轴上的标题
titlefont:字典型,同之前所有同名参数
type:str型,用于控制横坐标轴类型,'-'表示根据输入数据自适应调整,'linear'表示线性坐标轴,'log'表示对数坐标轴,'date'表示日期型坐标轴,'category'表示分类型坐标轴,默认为'-'
autorange:bool型或'reversed',控制是否根据横坐标对应的数据自动调整坐标轴范围,默认为True
range:list型,控制横坐标轴的区间范围,自行设置无默认项,取决于横坐标轴的数据类型,格式均为[左端点,右端点]
tickmode:str型,设置坐标轴刻度的格式,'auto'表示自动根据输入的数据来决定,'linear'表示线性的数值型,'array'表示由自定义的数组来表示(用数组来自定义刻度标签时必须选择此项)
tickvals:list、numpy array或pandas中的series,作为坐标轴刻度标签的替代(tickmode此时必须被设置为'array')
ticks:str型,控制刻度标签的书写位置,'outside'表示在外侧显示,'inside'表示在内侧显示,''表示不显示
ticklen:int型,设置刻度标签的像素长度
tickwidth:int型,设置刻度标签的像素宽度
tickcolor:str型,传入十六进制色彩,用于控制刻度标签的颜色
tickfont:字典型,同前面所有字典型字体控制参数,用于对刻度标签进行单独控制
tickangle:int型,设置刻度标签的旋转角度
showline:bool型,控制是否绘制出该坐标轴上的直线部分
linecolor:str型,十六进制色彩,控制坐标轴线条的色彩
linewidth:int型,设置坐标轴直线部分的像素宽度
showgrid:bool型,控制是否绘制网格线
gridcolor:str型,十六进制色彩,控制网格线的颜色
gridwidth:int型,控制网格线的像素宽度
zeroline:bool型,控制是否在0值处绘制0刻度线
side:str型,控制x(y)轴放置于作图区域的位置,'top'、'bottom'控制横轴放置于顶部亦或是底部;'left'、'right'控制纵轴放置于左侧亦或是右侧
下面是几个简单的示例。
1. 对横纵坐标轴标题字体进行修改。
import plotly
import plotly.graph_objs as go
import numpy as np
'''构造1000个服从二维正态分布的模拟数据'''
N = 1000
random_x = np.random.randn(N)
random_y = np.random.randn(N)
'''构造trace,配置相关参数'''
trace = go.Scatter(
 x = random_x,
 y = random_y,
 mode = 'markers'
)
'''将trace保存于列表之中'''
data = [trace]
'''创建layout对象,对横纵坐标轴的标题进行一定的设置'''
layout = go.Layout(xaxis={
 'title':'这是横坐标轴',
 'titlefont':{
 'size':30
 }
},yaxis={
 'title':'这是纵坐标轴',
 'titlefont':{
 'size':40
 }
})
'''将graph部分和layout部分组合成figure对象'''
fig = go.Figure(data=data, layout=layout)
'''启动绘图直接绘制figure对象'''
plotly.offline.init_notebook_mode()
plotly.offline.iplot(fig,filename='basic-scatter')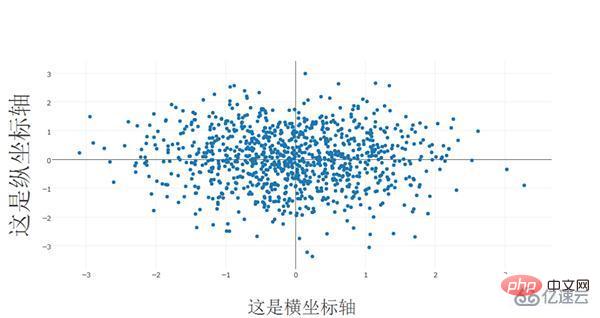
2. 对横纵方向的坐标轴线条及网格进行设置
import plotly
import plotly.graph_objs as go
import numpy as np
'''构造1000个服从二维正态分布的模拟数据'''
N = 1000
random_x = np.random.randn(N)
random_y = np.random.randn(N)
'''构造trace,配置相关参数'''
trace = go.Scatter(
 x = random_x,
 y = random_y,
 mode = 'markers'
)
'''将trace保存于列表之中'''
data = [trace]
'''创建layout对象,对横纵坐标轴的线条及网格颜色进行一定的设置'''
layout = go.Layout(xaxis={
 'showline':False,
 'showgrid':True,
 'zeroline':False,
 'showgrid':True,
 'gridcolor':'7fecad'
 },yaxis={
'showline':False,
 'showgrid':True,
 'gridcolor':'#3d3b4f',
 'zeroline':False
})
'''将graph部分和layout部分组合成figure对象'''
fig = go.Figure(data=data, layout=layout)
'''启动绘图直接绘制figure对象'''
plotly.offline.init_notebook_mode()
plotly.offline.iplot(fig,filename='basic-scatter')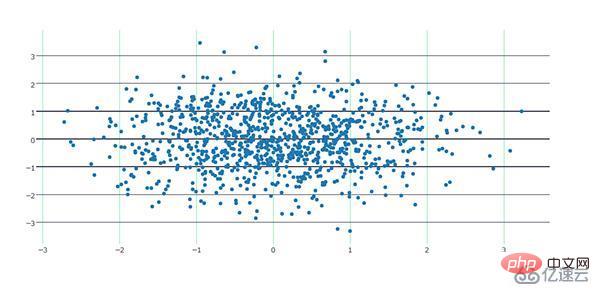
2.4.3 图例
showlegend:bool型,控制是否绘制图例
legend:字典型,用于控制用图例相关的所有属性的设置,主要键如下:
bgcolor:str型,十六进制设置图例背景颜色
bordercolor:设置图例边框的颜色
borderwidth:int型,设置图例边框的颜色
font:字典型,设置图例文字部分的字体,同前面所有font设置规则
orientation:str型,设置图例各元素的堆叠方向,'v'表示竖直,'h'表示水平堆叠
x:数值型,-2到3之间,用于设置图例在水平方向上的位置,默认为1.02
xanchor:str型,用于直接设置图例水平位置的固定位置,有'left'、'center'、'right'和'auto'几个可选项
y:数值型,-2到3之间,用于设置图例在竖直方向上的位置,默认为1
yanchor:str型,用于直接设置图例竖直方向上的固定位置,有'top'、'middle'、'bottom'和'auto'几个选项
下面是一个简单的例子。
将图例的位置挪动到图像中心,即百分比上(0.5,0.5)的位置:
import numpy as np
import plotly
import plotly.graph_objs as go
'''创建仿真数据'''
N = 100
random_x = np.linspace(0, 1, N)
random_y0 = np.random.randn(N)+5
random_y1 = np.random.randn(N)
random_y2 = np.random.randn(N)-5
'''构造trace0'''
trace0 = go.Scatter(
 x = random_x,
 y = random_y0,
 mode = 'markers',
 name = 'markers'
)
'''构造trace1'''
trace1 = go.Scatter(
 x = random_x,
 y = random_y1,
 mode = 'lines+markers',
 name = 'lines+markers'
)
'''构造trace2'''
trace2 = go.Scatter(
 x = random_x,
 y = random_y2,
 mode = 'lines',
 name = 'lines'
)
'''将所有trace保存在列表中'''
data = [trace0, trace1, trace2]
'''构造layout对象,对图例位置进行一定的设置'''
layout = go.Layout(legend={
 'x':0.5,
 'y':0.5
})
'''构造figure对象'''
fig = go.Figure(data=data,layout=layout)
'''启动绘图'''
plotly.offline.init_notebook_mode()
plotly.offline.iplot(fig, filename='scatter-mode')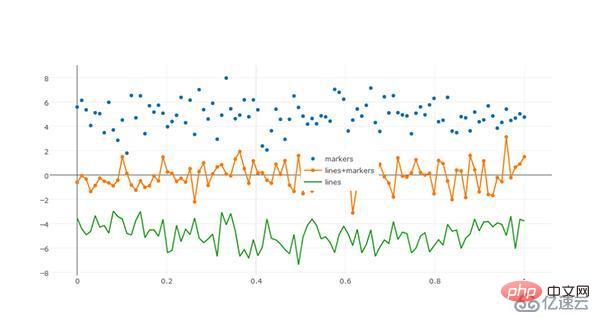
2.4.4 其它杂项
width:int型,控制图像的像素宽度,默认为700
height:int型,控制图像的像素高度,默认为450
margin:字典型输入,控制图像边界的宽度,其主要键如下:
l:int型,控制图像距离左边界的留白区域像素宽度,默认为80
r:int型,控制图像距离右边界的留白区域像素宽度,默认为80
t:int型,控制图像距离上边界的留白区域像素宽度,默认为100
b:int型,控制图像距离下边界的留白区域像素宽度,默认为80
pad:int型,控制坐标轴与图像区域的像素距离,默认为0
paper_bgcolor:str型,传入十六进制色彩,控制图床的颜色
plot_bgcolor:str型,传入十六进制色彩,控制绘图区域的颜色
hidesources:bool型,控制是否在图像的右下角标记来源link
hovermode:str型或False,用于设置悬停交互的方式,有'x'、'y'、'closest'和False这几个可选项,False表示无悬停交互方式
hoverlabel:字典型输入,用于控制悬停时出现的信息框的各属性,主要键如下:
bgcolor:str型,传入十六进制色彩,控制信息框的背景色
bordercolor:str型,传入十六进制色彩,控制信息框边框的颜色
font:字典型,控制信息框中字体的各属性,其主要键如下:
family:同之前,控制字体
size:int型,控制字体大小,默认13
color:str型,传入十六进制色彩,控制字体颜色
namelength:int型,控制对信息框中显示的对应trace的名字的长度限制,建议设置为-1,即全部显示,默认为15,即对于长于15的trace只显示前15个字符
grid:字典型,控制一页多图(subplots)时的规划多个图的网格的属性,其常用键如下:
rows:int型,控制网格中的行数(放置笛卡尔坐标系类型的子图),也可以设置多于实际绘图需求的行数以达到留白的目的
roworder:str型,设置子图按行,是从下往上叠加还是从上往下叠加,对应'top to bottom'和'bottom to top',默认为'top to bottm',注意,只可以设置行的叠加顺序,列方向上的叠加顺序始终为从左往右
columns:int型,同rows,控制网格的列数
pattern:str型,用于控制一页多图中子图之间坐标轴的共享情况,'coupled'表示每一列共享同一个x轴,每一行共享一个y轴,'independent'表示每个子图xy轴独立(这在进行量纲相差较大的子图的绘制尤为有用)
xgap:float型,0.0-1.0之间,用于控制子图之间的水平空白区域宽度占一个子图宽度的百分比
ygap:同xgap,控制竖直方向上子图之间的宽度
domain:字典型,设置一页多图时,子图占据的区域距离上下左右边界的宽度情况,其主要键如下:
x:list型,格式为[x1,x2],x1控制子图区域左端与图床左端的距离,x2控制子图区域右端与图床左端的距离,x1、x2都代表百分比,在0.0-1.0之间取值
y:同x,控制子图区域上下端分别与图床上端的距离百分比
Ce qui précède est le contenu détaillé de. pour plus d'informations, suivez d'autres articles connexes sur le site Web de PHP en chinois!

