Maison >développement back-end >Tutoriel Python >Bases de Python Matplotlib : utilisation courante et exemples
Bases de Python Matplotlib : utilisation courante et exemples
- 王林avant
- 2023-04-20 19:52:161859parcourir
Matplotlib
Matplotlib est un outil de dessin similaire à MATLAB en Python Si vous êtes familier avec MATLAB, vous pouvez rapidement démarrer avec Matplotlib.
1. Comprendre Matploblib
1.1 Figure
Avant tout dessin, nous avons besoin d'un objet Figure, ce qui peut être compris comme nous avons besoin d'une planche à dessin pour commencer à dessiner.
import matplotlib.pyplot as plt
fig = plt.figure()
1.2 Axes
Après avoir l'objet Figure, nous avons besoin d'axes avant de dessiner. Sans axes, il n'y aura pas de référence de dessin, nous devons donc ajouter des axes. Il peut également être compris comme du papier qui peut réellement être utilisé pour dessiner. Le code sur
fig = plt.figure()
ax = fig.add_subplot(111)
ax.set(xlim=[0.5, 4.5], ylim=[-2, 8], title='An Example Axes',
       ylabel='Y-Axis', xlabel='X-Axis')
plt.show()
ajoute un Axes à une image, puis définit la plage de valeurs de l'axe X et de l'axe Y des Axes (ces paramètres ne sont pas obligatoires, et nous parlerons de ces paramètres plus tard), L'effet est la suivante :
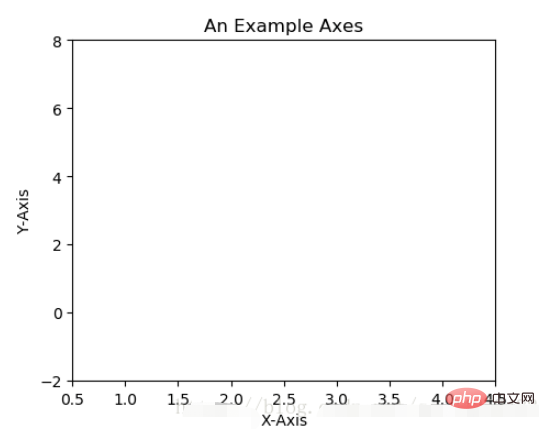
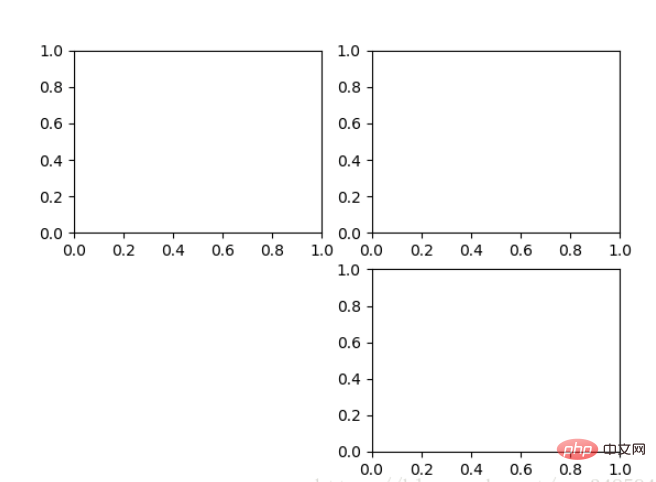
Pour ce qui précède, fig.add_subplot(111) consiste à ajouter des axes, l'explication du paramètre est générée en première position de la 1ère ligne et de la 1ère colonne de la planche à dessin . Objet haches à préparer pour la peinture. Les axes peuvent également être générés via fig.add_subplot(2, 2, 1) Les deux premiers paramètres déterminent la division du panneau, comme 2. 2 divisera l'ensemble du panneau en 2 * 2 carrés. . grille, la troisième plage de valeurs du paramètre est [1, 2*2] indiquant quels axes. Comme l'exemple suivant : fig.add_subplot(111)就是添加Axes的,参数的解释的在画板的第1行第1列的第一个位置生成一个Axes对象来准备作画。也可以通过fig.add_subplot(2, 2, 1)的方式生成Axes,前面两个参数确定了面板的划分,例如 2, 2会将整个面板划分成 2 * 2 的方格,第三个参数取值范围是 [1, 2*2] 表示第几个Axes。如下面的例子:
fig = plt.figure()
ax1 = fig.add_subplot(221)
ax2 = fig.add_subplot(222)
ax3 = fig.add_subplot(224)
1.3 Multiple Axes
可以发现我们上面添加 Axes 似乎有点弱鸡,所以提供了下面的方式一次性生成所有 Axes:
fig, axes = plt.subplots(nrows=2, ncols=2)
axes[0,0].set(title='Upper Left')
axes[0,1].set(title='Upper Right')
axes[1,0].set(title='Lower Left')
axes[1,1].set(title='Lower Right')
fig 还是我们熟悉的画板, axes 成了我们常用二维数组的形式访问,这在循环绘图时,额外好用。
1.4 Axes Vs .pyplot
相信不少人看过下面的代码,很简单并易懂,但是下面的作画方式只适合简单的绘图,快速的将图绘出。在处理复杂的绘图工作时,我们还是需要使用 Axes 来完成作画的。
plt.plot([1, 2, 3, 4], [10, 20, 25, 30], color='lightblue', linewidth=3)
plt.xlim(0.5, 4.5)
plt.show()
2. 基本绘图2D
2.1 线
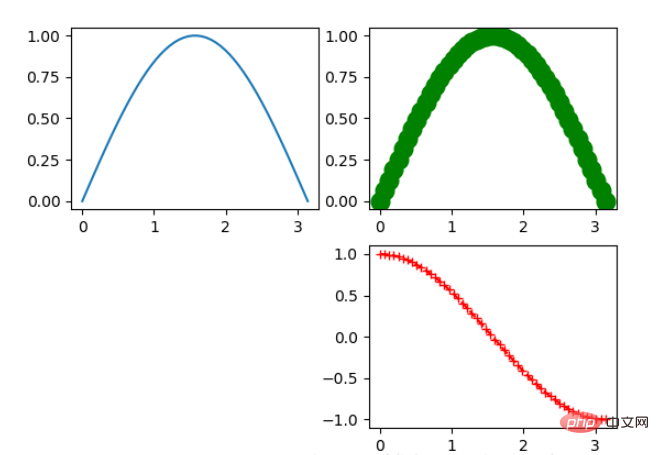
plot()函数画出一系列的点,并且用线将它们连接起来。看下例子:
x = np.linspace(0, np.pi)
y_sin = np.sin(x)
y_cos = np.cos(x)

ax1.plot(x, y_sin)
ax2.plot(x, y_sin, 'go--', linewidth=2, markersize=12)
ax3.plot(x, y_cos, color='red', marker='+', linestyle='dashed')
在上面的三个Axes上作画。plot,前面两个参数为x轴、y轴数据。ax2的第三个参数是 MATLAB风格的绘图,对应ax3上的颜色,marker,线型。
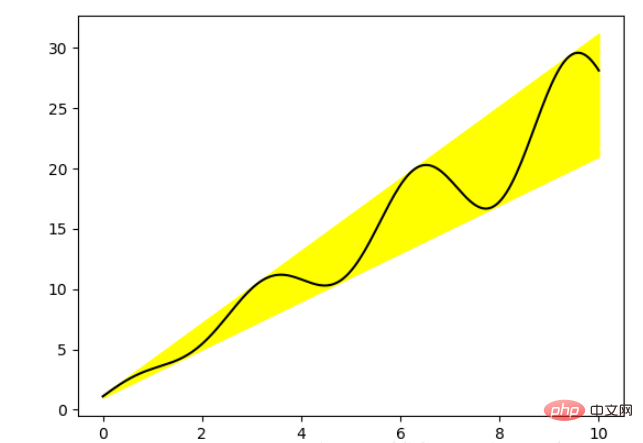
另外,我们可以通过关键字参数的方式绘图,如下例:
x = np.linspace(0, 10, 200)
data_obj = {'x': x,
            'y1': 2 * x + 1,
            'y2': 3 * x + 1.2,
            'mean': 0.5 * x * np.cos(2*x) + 2.5 * x + 1.1}

fig, ax = plt.subplots()

#填充两条线之间的颜色
ax.fill_between('x', 'y1', 'y2', color='yellow', data=data_obj)

# Plot the "centerline" with `plot`
ax.plot('x', 'mean', color='black', data=data_obj)

plt.show()
发现上面的作图,在数据部分只传入了字符串,这些字符串对一个这 data_obj 中的关键字,当以这种方式作画时,将会在传入给 data 中寻找对应关键字的数据来绘图。
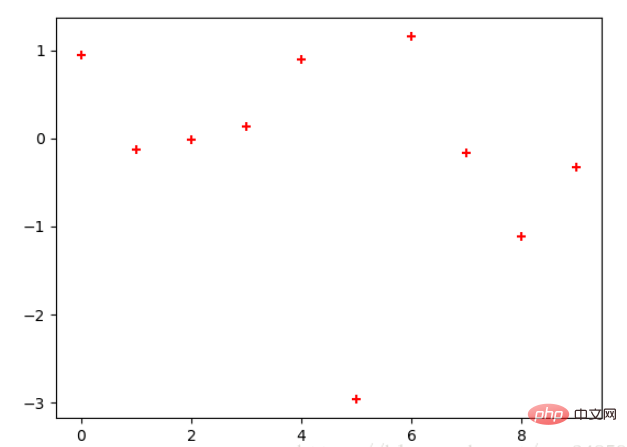
2.2 散点图
只画点,但是不用线连接起来。
x = np.arange(10)
y = np.random.randn(10)
plt.scatter(x, y, color='red', marker='+')
plt.show()
2.3 条形图
条形图分两种,一种是水平的,一种是垂直的,见下例子:
np.random.seed(1)
x = np.arange(5)
y = np.random.randn(5)

fig, axes = plt.subplots(ncols=2, figsize=plt.figaspect(1./2))

vert_bars = axes[0].bar(x, y, color='lightblue', align='center')
horiz_bars = axes[1].barh(x, y, color='lightblue', align='center')
#在水平或者垂直方向上画线
axes[0].axhline(0, color='gray', linewidth=2)
axes[1].axvline(0, color='gray', linewidth=2)
plt.show()
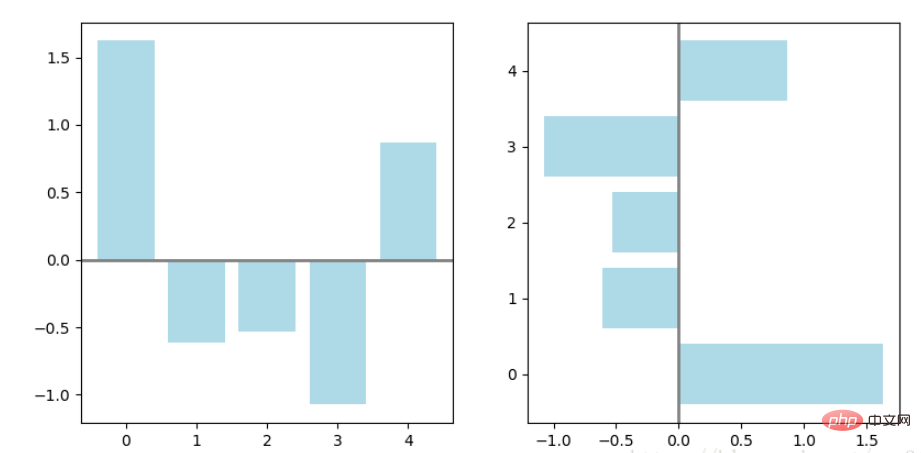
条形图还返回了一个Artists 数组,对应着每个条形,例如上图 Artists 数组的大小为5,我们可以通过这些 Artists 对条形图的样式进行更改,如下例:
fig, ax = plt.subplots()
vert_bars = ax.bar(x, y, color='lightblue', align='center')
# We could have also done this with two separate calls to `ax.bar` and numpy boolean indexing.
for bar, height in zip(vert_bars, y):
if height < 0:
bar.set(edgecolor='darkred', color='salmon', linewidth=3)
plt.show()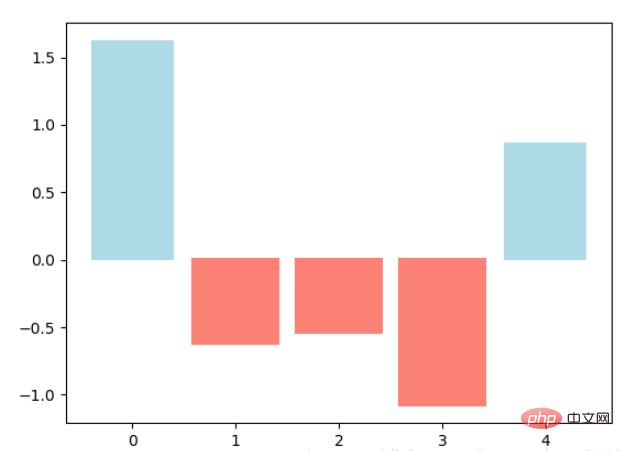
2.4 直方图
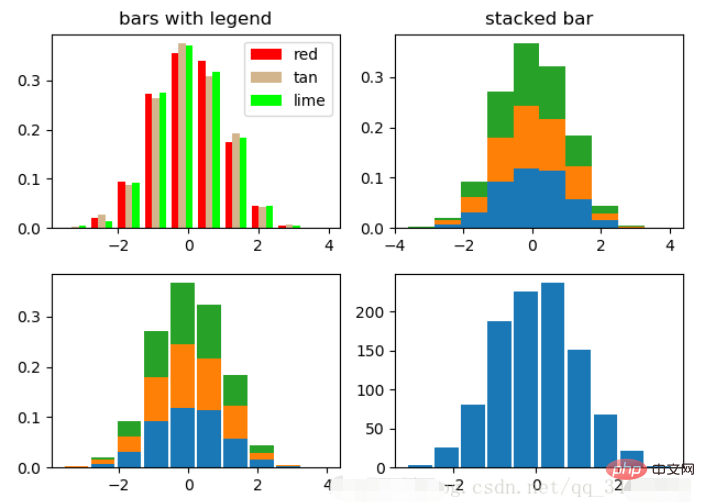
直方图用于统计数据出现的次数或者频率,有多种参数可以调整,见下例:
np.random.seed(19680801)

n_bins = 10
x = np.random.randn(1000, 3)

fig, axes = plt.subplots(nrows=2, ncols=2)
ax0, ax1, ax2, ax3 = axes.flatten()

colors = ['red', 'tan', 'lime']
ax0.hist(x, n_bins, density=True, histtype='bar', color=colors, label=colors)
ax0.legend(prop={'size': 10})
ax0.set_title('bars with legend')

ax1.hist(x, n_bins, density=True, histtype='barstacked')
ax1.set_title('stacked bar')

ax2.hist(x,  histtype='barstacked', rwidth=0.9)

ax3.hist(x[:, 0], rwidth=0.9)
ax3.set_title('different sample sizes')

fig.tight_layout()
plt.show()参数中density控制Y轴是概率还是数量,与返回的第一个的变量对应。histtype控制着直方图的样式,默认是 ‘bar’,对于多个条形时就相邻的方式呈现如子图1, ‘barstacked’ 就是叠在一起,如子图2、3。 rwidth 控制着宽度,这样可以空出一些间隙,比较图2、3. 图4是只有一条数据时。
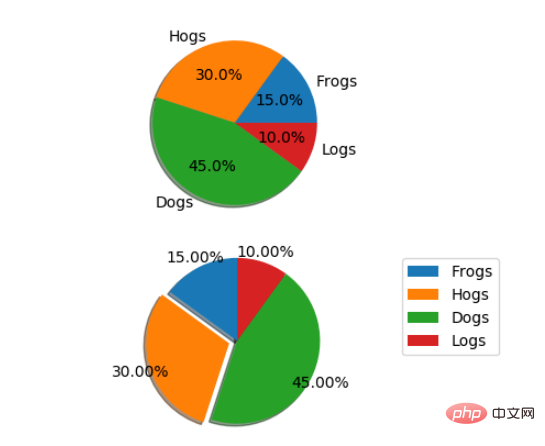
2.5 饼图
labels = 'Frogs', 'Hogs', 'Dogs', 'Logs'
sizes = [15, 30, 45, 10]
explode = (0, 0.1, 0, 0)  # only "explode" the 2nd slice (i.e. 'Hogs')

fig1, (ax1, ax2) = plt.subplots(2)
ax1.pie(sizes, labels=labels, autopct='%1.1f%%', shadow=True)
ax1.axis('equal')
ax2.pie(sizes, autopct='%1.2f%%', shadow=True, startangle=90, explode=explode,
    pctdistance=1.12)
ax2.axis('equal')
ax2.legend(labels=labels, loc='upper right')

plt.show()饼图自动根据数据的百分比画饼.。labels是各个块的标签,如子图一。autopct=%1.1f%%表示格式化百分比精确输出,explode,突出某些块,不同的值突出的效果不一样。pctdistance=1.12
fig, (ax1, ax2) = plt.subplots(2)
ax1.boxplot(data)
ax2.boxplot(data2, vert=False) #控制方向

 1.3 Axes multiples
np.random.seed(19680801)


N = 50
x = np.random.rand(N)
y = np.random.rand(N)
colors = np.random.rand(N)
area = (30 * np.random.rand(N))**2  # 0 to 15 point radii

plt.scatter(x, y, s=area, c=colors, alpha=0.5)
plt.show()
🎜fig est toujours la planche à dessin que nous connaissons , les axes sont devenus notre forme courante d'accès aux tableaux bidimensionnels , ce qui est particulièrement utile lors du dessin en boucle. 🎜🎜1.4 Axes Vs .pyplot🎜🎜Je pense que beaucoup de gens ont vu le code suivant. Il est très simple et facile à comprendre, mais la méthode de dessin suivante ne convient qu'au dessin simple et au dessin rapide. Lorsqu'il s'agit d'un travail de dessin complexe, nous devons toujours utiliser des axes pour terminer la peinture. 🎜
fig, (ax1, ax2) = plt.subplots(2)
x = np.arange(-5, 5, 0.1)
y = np.arange(-5, 5, 0.1)
xx, yy = np.meshgrid(x, y, sparse=True)
z = np.sin(xx**2 + yy**2) / (xx**2 + yy**2)
ax1.contourf(x, y, z)
ax2.contour(x, y, z)
🎜2. Dessin de base 2D🎜🎜2.1 La fonction Line🎜🎜plot() dessine une série de points et les relie avec des lignes. Jetez un œil à l'exemple : 🎜
ax.set_xlim([xmin, xmax])   #设置X轴的区间
ax.set_ylim([ymin, ymax])   #Y轴区间
ax.axis([xmin, xmax, ymin, ymax])   #X、Y轴区间
ax.set_ylim(bottom=-10)     #Y轴下限
ax.set_xlim(right=25)       #X轴上限
🎜Peignez sur les trois axes ci-dessus. tracé, les deux premiers paramètres sont les données des axes x et y. Le troisième paramètre de ax2 est un dessin de style MATLAB, correspondant à la couleur, au marqueur et au style de ligne sur ax3. 🎜🎜
 🎜🎜De plus, nous pouvons utiliser Drawing sous la forme de paramètres de mot-clé, comme dans l'exemple suivant : 🎜
x = np.linspace(0, 2*np.pi)
y = np.sin(x)
fig, (ax1, ax2) = plt.subplots(2)
ax1.plot(x, y)
ax2.plot(x, y)
ax2.set_xlim([-1, 6])
ax2.set_ylim([-1, 3])
plt.show()
🎜 a constaté que dans le dessin ci-dessus, seules les chaînes ont été transmises dans la partie données. Ces chaînes correspondent à un mot-clé dans data_obj. De cette façon, les données correspondant au mot-clé seront recherchées dans les données transmises à dessiner. 🎜🎜
 🎜🎜2.2 Nuage de points 🎜 🎜Dessinez simplement des points, mais ne les connectez pas avec des lignes. 🎜
fig, ax = plt.subplots()
ax.plot([1, 2, 3, 4], [10, 20, 25, 30], label='Philadelphia')
ax.plot([1, 2, 3, 4], [30, 23, 13, 4], label='Boston')
ax.scatter([1, 2, 3, 4], [20, 10, 30, 15], label='Point')
ax.set(ylabel='Temperature (deg C)', xlabel='Time', title='A tale of two cities')
ax.legend()
plt.show()
🎜
 🎜🎜2.3 Bar graphique 🎜🎜Il existe deux types de graphiques à barres, l'un est horizontal et l'autre vertical, voir l'exemple ci-dessous : 🎜
data = [('apples', 2), ('oranges', 3), ('peaches', 1)]
fruit, value = zip(*data)

fig, (ax1, ax2) = plt.subplots(2)
x = np.arange(len(fruit))
ax1.bar(x, value, align='center', color='gray')
ax2.bar(x, value, align='center', color='gray')

ax2.set(xticks=x, xticklabels=fruit)

#ax.tick_params(axis='y', direction='inout', length=10) #修改 ticks 的方向以及长度
plt.show()
🎜
 🎜🎜Le graphique à barres renvoie également un tableau Artistes, correspondant à chaque barre. Par exemple, la taille du tableau Artistes dans l'image ci-dessus est 5, nous pouvons utiliser ces artistes pour changer le style du graphique à barres, comme dans l'exemple suivant : 🎜
fig, axes = plt.subplots(2, 2, figsize=(9, 9))
fig.subplots_adjust(wspace=0.5, hspace=0.3,
                    left=0.125, right=0.9,
                    top=0.9,    bottom=0.1)

#fig.tight_layout() #自动调整布局,使标题之间不重叠
plt.show()
🎜 🎜🎜2.4 Histogramme🎜🎜L'histogramme est utilisé pour compter le nombre ou la fréquence des occurrences de données. De nombreux paramètres peuvent être ajustés, voir le exemple suivant : 🎜
fig, (ax1, ax2) = plt.subplots(1, 2, sharex=True, sharey=True)
ax1.plot([1, 2, 3, 4], [1, 2, 3, 4])
ax2.plot([3, 4, 5, 6], [6, 5, 4, 3])
plt.show()
🎜
density dans le code des paramètres>Contrôlez si l'axe Y est une probabilité ou une quantité, correspondant à la première variable renvoyée. <code>histtype contrôle le style de l'histogramme. La valeur par défaut est «bar». Pour plusieurs barres, elles seront affichées adjacentes comme indiqué dans le sous-graphique 1. «barstacked» sous-graphique 1. Figures 2 et 3. rwidth contrôle la largeur, ce qui peut laisser des espaces. Comparez les figures 2 et 3. La figure 4 correspond à une seule donnée. 🎜🎜 🎜🎜2.5 Diagramme circulaire 🎜
fig, ax = plt.subplots()
ax.plot([-2, 2, 3, 4], [-10, 20, 25, 5])
ax.spines['top'].set_visible(False)     #顶边界不可见
ax.xaxis.set_ticks_position('bottom')  # ticks 的位置为下方,分上下的。
ax.spines['right'].set_visible(False)   #右边界不可见
ax.yaxis.set_ticks_position('left')

# "outward"
# 移动左、下边界离 Axes 10 个距离
#ax.spines['bottom'].set_position(('outward', 10))
#ax.spines['left'].set_position(('outward', 10))

# "data"
# 移动左、下边界到 (0, 0) 处相交
ax.spines['bottom'].set_position(('data', 0))
ax.spines['left'].set_position(('data', 0))

# "axes"
# 移动边界,按 Axes 的百分比位置
#ax.spines['bottom'].set_position(('axes', 0.75))
#ax.spines['left'].set_position(('axes', 0.3))

plt.show()
🎜Le diagramme circulaire dessine automatiquement un secteur en fonction du pourcentage des données.
labels est l'étiquette de chaque bloc, comme la sous-image 1. autopct=%1.1f%% signifie une sortie formatée avec un pourcentage précis, explode met en évidence certains blocs et différentes valeurs ont des effets de mise en évidence différents. pctdistance=1.12La distance entre le pourcentage et le centre du cercle, la valeur par défaut est 0,6.🎜🎜🎜🎜2.6 箱形图
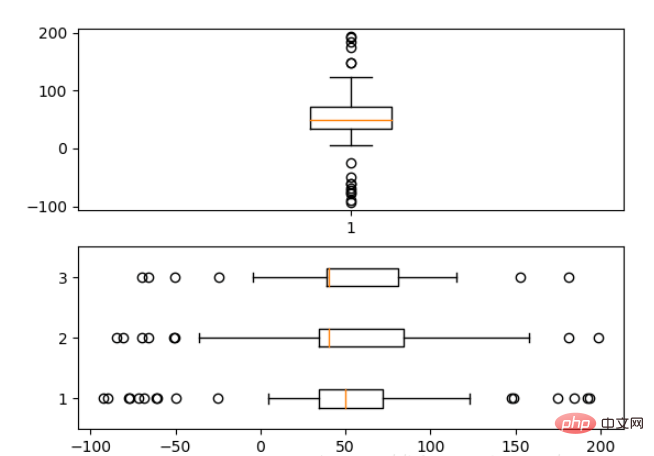
为了专注于如何画图,省去数据的处理部分。 data 的 shape 为 (n, ), data2 的 shape 为 (n, 3)。
fig, (ax1, ax2) = plt.subplots(2)
ax1.boxplot(data)
ax2.boxplot(data2, vert=False) #控制方向
2.7 泡泡图
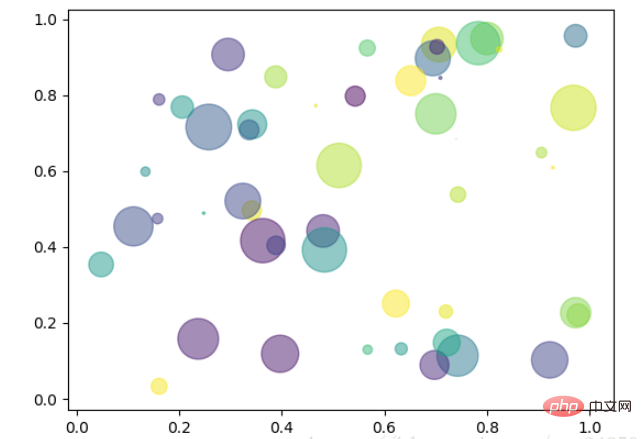
散点图的一种,加入了第三个值 s 可以理解成普通散点,画的是二维,泡泡图体现了Z的大小,如下例:
np.random.seed(19680801)


N = 50
x = np.random.rand(N)
y = np.random.rand(N)
colors = np.random.rand(N)
area = (30 * np.random.rand(N))**2  # 0 to 15 point radii

plt.scatter(x, y, s=area, c=colors, alpha=0.5)
plt.show()
2.8 等高线(轮廓图)
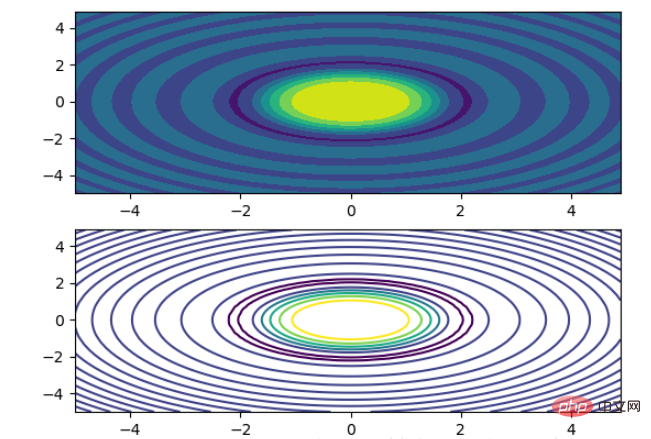
有时候需要描绘边界的时候,就会用到轮廓图,机器学习用的决策边界也常用轮廓图来绘画,见下例:
fig, (ax1, ax2) = plt.subplots(2)
x = np.arange(-5, 5, 0.1)
y = np.arange(-5, 5, 0.1)
xx, yy = np.meshgrid(x, y, sparse=True)
z = np.sin(xx**2 + yy**2) / (xx**2 + yy**2)
ax1.contourf(x, y, z)
ax2.contour(x, y, z)
上面画了两个一样的轮廓图,contourf会填充轮廓线之间的颜色。数据x, y, z通常是具有相同 shape 的二维矩阵。x, y 可以为一维向量,但是必需有 z.shape = (y.n, x.n) ,这里 y.n 和 x.n 分别表示x、y的长度。Z通常表示的是距离X-Y平面的距离,传入X、Y则是控制了绘制等高线的范围。
3 布局、图例说明、边界等
3.1区间上下限
当绘画完成后,会发现X、Y轴的区间是会自动调整的,并不是跟我们传入的X、Y轴数据中的最值相同。为了调整区间我们使用下面的方式:
ax.set_xlim([xmin, xmax])   #设置X轴的区间
ax.set_ylim([ymin, ymax])   #Y轴区间
ax.axis([xmin, xmax, ymin, ymax])   #X、Y轴区间
ax.set_ylim(bottom=-10)     #Y轴下限
ax.set_xlim(right=25)       #X轴上限
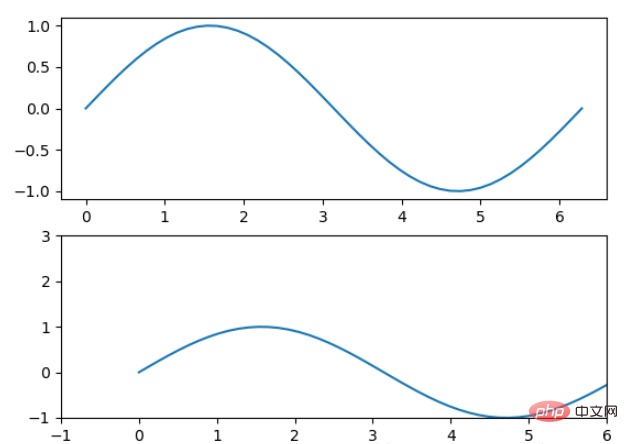
具体效果见下例:
x = np.linspace(0, 2*np.pi)
y = np.sin(x)
fig, (ax1, ax2) = plt.subplots(2)
ax1.plot(x, y)
ax2.plot(x, y)
ax2.set_xlim([-1, 6])
ax2.set_ylim([-1, 3])
plt.show()
可以看出修改了区间之后影响了图片显示的效果。
3.2 图例说明
我们如果我们在一个Axes上做多次绘画,那么可能出现分不清哪条线或点所代表的意思。这个时间添加图例说明,就可以解决这个问题了,见下例:
fig, ax = plt.subplots()
ax.plot([1, 2, 3, 4], [10, 20, 25, 30], label='Philadelphia')
ax.plot([1, 2, 3, 4], [30, 23, 13, 4], label='Boston')
ax.scatter([1, 2, 3, 4], [20, 10, 30, 15], label='Point')
ax.set(ylabel='Temperature (deg C)', xlabel='Time', title='A tale of two cities')
ax.legend()
plt.show()
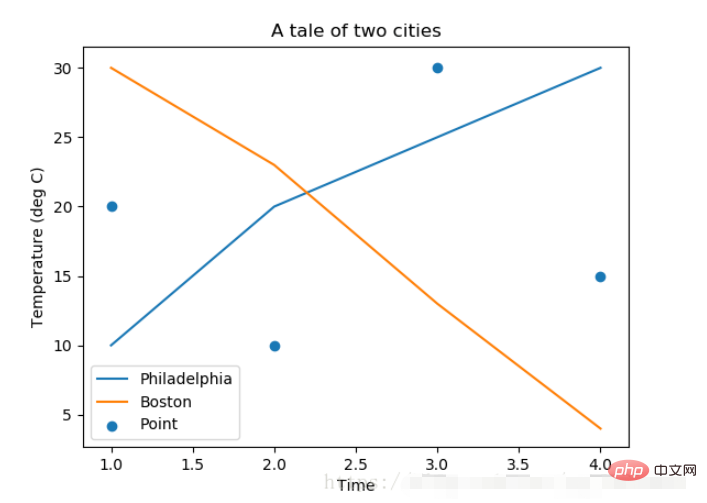
在绘图时传入 label 参数,并最后调用ax.legend()显示体力说明,对于 legend 还是传入参数,控制图例说明显示的位置:
| Location String | Location Code |
|---|---|
| ‘best’ | 0 |
| ‘upper right’ | 1 |
| ‘upper left’ | 2 |
| ‘lower left’ | 3 |
| ‘lower right’ | 4 |
| ‘right’ | 5 |
| ‘center left’ | 6 |
| ‘center right’ | 7 |
| ‘lower center’ | 8 |
| ‘upper center’ | 9 |
| ‘center’ | 10 |
3.3 区间分段
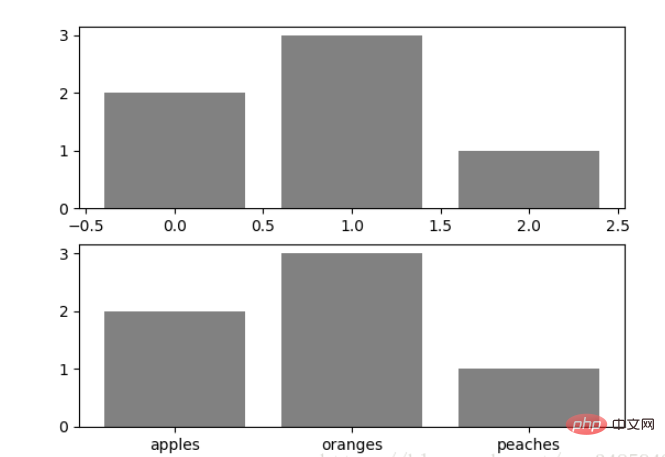
默认情况下,绘图结束之后,Axes 会自动的控制区间的分段。见下例:
data = [('apples', 2), ('oranges', 3), ('peaches', 1)]
fruit, value = zip(*data)

fig, (ax1, ax2) = plt.subplots(2)
x = np.arange(len(fruit))
ax1.bar(x, value, align='center', color='gray')
ax2.bar(x, value, align='center', color='gray')

ax2.set(xticks=x, xticklabels=fruit)

#ax.tick_params(axis='y', direction='inout', length=10) #修改 ticks 的方向以及长度
plt.show()
上面不仅修改了X轴的区间段,并且修改了显示的信息为文本。
3.4 布局
当我们绘画多个子图时,就会有一些美观的问题存在,例如子图之间的间隔,子图与画板的外边间距以及子图的内边距,下面说明这个问题:
fig, axes = plt.subplots(2, 2, figsize=(9, 9))
fig.subplots_adjust(wspace=0.5, hspace=0.3,
                    left=0.125, right=0.9,
                    top=0.9,    bottom=0.1)

#fig.tight_layout() #自动调整布局,使标题之间不重叠
plt.show()通过fig.subplots_adjust()我们修改了子图水平之间的间隔wspace=0.5,垂直方向上的间距hspace=0.3,左边距left=0.125 等等,这里数值都是百分比的。以 [0, 1] 为区间,选择left、right、bottom、top 注意 top 和 right 是 0.9 表示上、右边距为百分之10。不确定如果调整的时候,fig.tight_layout()是一个很好的选择。之前说到了内边距,内边距是子图的,也就是 Axes 对象,所以这样使用 ax.margins(x=0.1, y=0.1),当值传入一个值时,表示同时修改水平和垂直方向的内边距。
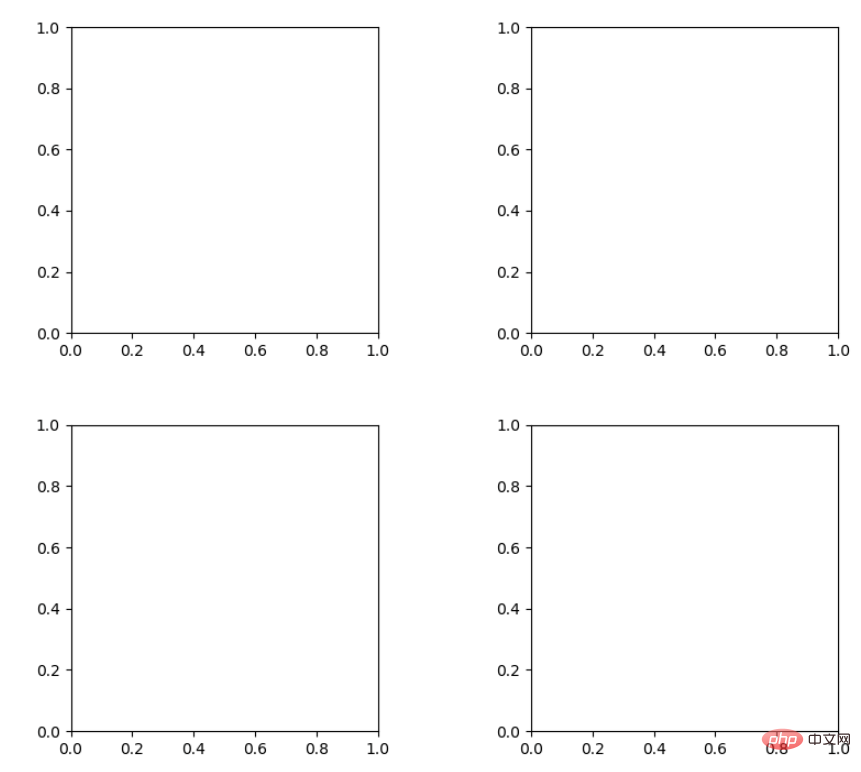
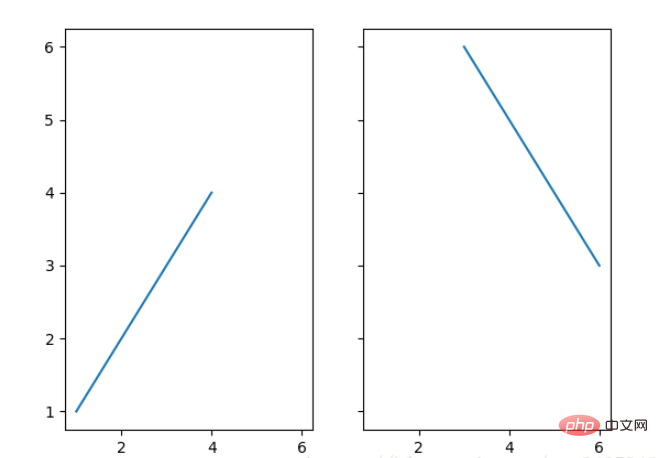
观察上面的四个子图,可以发现他们的X、Y的区间是一致的,而且这样显示并不美观,所以可以调整使他们使用一样的X、Y轴:
fig, (ax1, ax2) = plt.subplots(1, 2, sharex=True, sharey=True)
ax1.plot([1, 2, 3, 4], [1, 2, 3, 4])
ax2.plot([3, 4, 5, 6], [6, 5, 4, 3])
plt.show()
3.5 轴相关
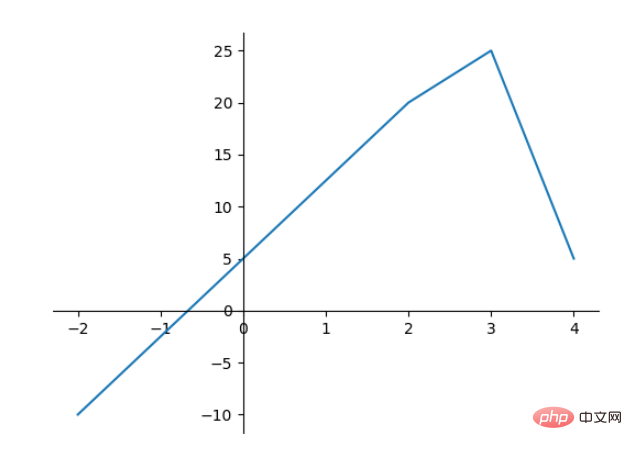
改变边界的位置,去掉四周的边框:
fig, ax = plt.subplots()
ax.plot([-2, 2, 3, 4], [-10, 20, 25, 5])
ax.spines['top'].set_visible(False)     #顶边界不可见
ax.xaxis.set_ticks_position('bottom')  # ticks 的位置为下方,分上下的。
ax.spines['right'].set_visible(False)   #右边界不可见
ax.yaxis.set_ticks_position('left')

# "outward"
# 移动左、下边界离 Axes 10 个距离
#ax.spines['bottom'].set_position(('outward', 10))
#ax.spines['left'].set_position(('outward', 10))

# "data"
# 移动左、下边界到 (0, 0) 处相交
ax.spines['bottom'].set_position(('data', 0))
ax.spines['left'].set_position(('data', 0))

# "axes"
# 移动边界,按 Axes 的百分比位置
#ax.spines['bottom'].set_position(('axes', 0.75))
#ax.spines['left'].set_position(('axes', 0.3))

plt.show()
Ce qui précède est le contenu détaillé de. pour plus d'informations, suivez d'autres articles connexes sur le site Web de PHP en chinois!

