Maison >interface Web >Questions et réponses frontales >Comment ajouter un diagramme circulaire echarts pour réagir au projet
Comment ajouter un diagramme circulaire echarts pour réagir au projet
- 藏色散人original
- 2023-01-03 10:05:402505parcourir
Comment ajouter un diagramme circulaire echarts pour réagir au projet : 1. Installez "echarts" via la commande "npm install echarts --save" ; 2. Utilisez l'importation pour introduire "echarts/lib/echarts" 3. Via "componentDidMount() ; {. ..}" Ajoutez simplement un diagramme circulaire echarts.

L'environnement d'exploitation de ce tutoriel : système Windows 10, React version 18.0.0, ordinateur Dell G3.
Comment ajouter un diagramme circulaire echarts pour réagir au projet ?
Utilisation du diagramme circulaire echarts dans le projet React
1. Installez
npm install echarts --save
2. Présentez
import echarts from 'echarts/lib/echarts';
import  'echarts/lib/chart/pie';  //饼状图
import  'echarts/lib/component/tooltip';
import  'echarts/lib/component/title';
import  'echarts/lib/component/legend'
import  'echarts/lib/component/markPoint'
3. Utilisez
componentDidMount() {
        //环形图百分比
        var huan_val = document.getElementsByClassName("huan")[0];
        var chart = echarts.init(huan_val);
        let option = {
            color: ["#f8e367", "#99dfff", "#58c0f0", "#5ea6ff", "#ff9e48", "#bcbcbc"],
            series: [{
                name: "驾驶分析",
                type: "pie",
                radius: ['60%', '80%'],
                avoidLabelOverlap: false,
                label: {
                    normal: {
                        show: false,
                        position: 'center'
                    },
                    emphasis: {
                        show: true,
                        textStyle: {
                            fontSize: '30',
                            fontWeight: 'bold'
                        }
                    }
                },
                labelLine: {
                    normal: {
                        show: false
                    }
                },
                data: [{
                    value: 33,
                    name: '慢速'
                }, {
                    value: 26,
                    name: '低速'
                }, {
                    value: 6,
                    name: '中速'
                }, {
                    value: 2,
                    name: '高速'
                }, {
                    value: 3,
                    name: '超速'
                }, {
                    value: 30,
                    name: '怠速'
                }]
            }]
        };
        chart.setOption(option);
    }
render(){
return(
<div></div>
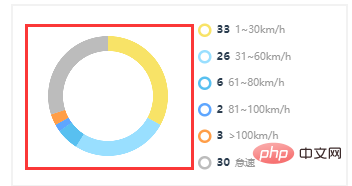
)} 4. Résultat
Recommandé apprentissage : "tutoriel vidéo React"
Ce qui précède est le contenu détaillé de. pour plus d'informations, suivez d'autres articles connexes sur le site Web de PHP en chinois!

