Maison >interface Web >js tutoriel >Comment implémenter le graphique linéaire dans echarts.js ? Code d'implémentation du graphique statistique de ligne echarts.js
Comment implémenter le graphique linéaire dans echarts.js ? Code d'implémentation du graphique statistique de ligne echarts.js
- 不言original
- 2018-08-17 10:25:454185parcourir
Le contenu de cet article explique comment implémenter le graphique linéaire d'echarts.js ? Le code d'implémentation du graphique statistique en ligne echarts.js a une certaine valeur de référence. Les amis dans le besoin peuvent s'y référer, j'espère qu'il vous sera utile.
<!DOCTYPE html PUBLIC "-//W3C//DTD XHTML 1.0 Transitional//EN" "http://www.w3.org/TR/xhtml1/DTD/xhtml1-transitional.dtd">
<html xmlns="http://www.w3.org/1999/xhtml">
<head>
<meta http-equiv="Content-Type" content="text/html; charset=utf-8" />
<title>常用的数据统计图</title>
<link type="text/css" rel="stylesheet" href="./css/index.css" />
<style type="text/css">
body{font-size:14px;color:#000;user-select:none;-webkit-user-select:none;-webkit-text-size-adjust:none;background-color:#fff;}
html,body{height:100%;}
*{font-family:"微软雅黑","华文细黑",Arial,Helvetica,sans-serif;}
a,input,div,textarea{outline:none;}
html,body,h1,h2,h3,h4,h5,h6,p,dl,dd,ol,ul,th,td,form,fieldset,input,button,textarea,a{margin:0;padding:0}
input,textarea,select{text-decoration:none;outline:0 none;resize:none;-webkit-tap-highlight-color:rgba(0,0,0,0);-webkit-appearance:none;border-radius:0;}
ul,dl,ol{list-style:none;}
ul,li{list-style:none;}
fieldset,img{border:0;}
a{text-decoration:none;outline:0 none;}
body{background-color:#faf9f4;}
p{color:#3d3d3d;font-size:20px;text-align:center;padding:100px 0 10px 0;}
#ring,#line,#pillar1,#pillar2{margin:0 auto;}
.null{padding-bottom:100px;}
</style>
</head>
<body>
<p>折线统计图</p>
<div id="line" style="width:822px;height:492px;"></div>
<div class="null"></div>
<script src="https://cdn.bootcss.com/jquery/3.3.1/jquery.min.js"></script>
<script src="https://cdn.bootcss.com/echarts/4.1.0.rc2/echarts.min.js"></script>
<!-- <script type="text/javascript" src="./js/jquery-1.7.2-min.js"></script>
<script type="text/javascript" src="./js/echarts.min.js"></script> -->
<script type="text/javascript">
// JavaScript Document
// echarts
// create for AgnesXu at 20161115
//折线图
var line = echarts.init(document.getElementById('line'));
line.setOption({
color:["#32d2c9"],
title: {
x: 'left',
text: '成绩统计',
textStyle: {
fontSize: '18',
color: '#4c4c4c',
fontWeight: 'bolder'
}
},
tooltip: {
trigger: 'axis'
},
toolbox: {
show: true,
orient: 'horizontal',
feature: {
dataZoom: {
yAxisIndex: 'none'
},
dataView: {readOnly: false},
magicType: {type: ['line', 'bar']}
}
},
xAxis: {
type: 'category',
boundaryGap: false,
data: ['周一','周二','周三','周四','周五','周六','周日'],
axisLabel: {
interval:0
}
},
yAxis: {
show: false,
type: 'value',
axisLabel: {
formatter: '{value} °C'
}
},
series: [
{
name:'成绩',
type:'line',
data:[23, 42, 18, 45, 48, 49,100],
markLine: {data: [{type: 'average', name: '平均值'}]}
}
]
}) ;
</script>
</body>
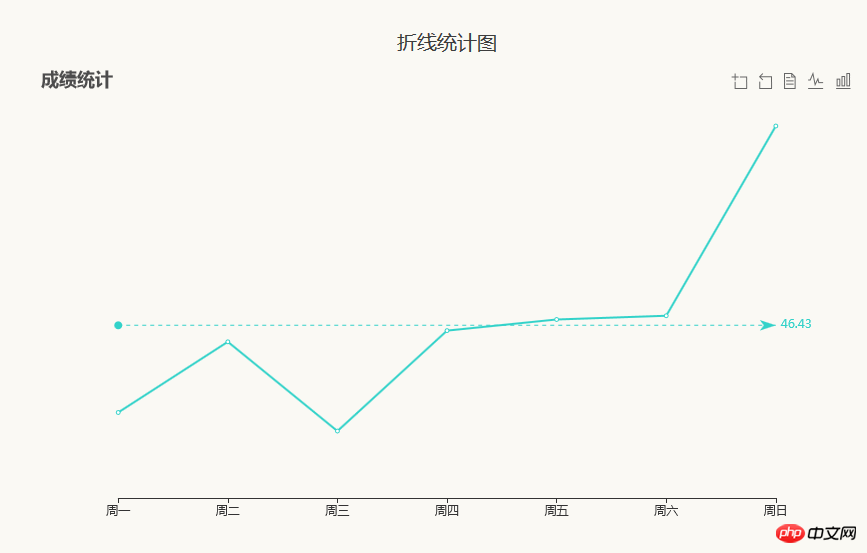
</html>Les résultats en cours d'exécution sont les suivants :

Recommandations associées :
Utilisez GD pour dessiner des graphiques en courbes dans php, gd dessine une polyligne
Le graphique linéaire de JQplot icon_html/css_WEB-ITnose
echarts définit la couleur de la ligne polyligne et polyligne Exemple de couleur de point
Ce qui précède est le contenu détaillé de. pour plus d'informations, suivez d'autres articles connexes sur le site Web de PHP en chinois!
Articles Liés
Voir plus- Une analyse approfondie du composant de groupe de liste Bootstrap
- Explication détaillée du currying de la fonction JavaScript
- Exemple complet de génération de mot de passe JS et de détection de force (avec téléchargement du code source de démonstration)
- Angularjs intègre l'interface utilisateur WeChat (weui)
- Comment basculer rapidement entre le chinois traditionnel et le chinois simplifié avec JavaScript et l'astuce permettant aux sites Web de prendre en charge le basculement entre les compétences en chinois simplifié et traditionnel_javascript

