Maison >développement back-end >Tutoriel Python >Python dessine des graphiques 3D
Python dessine des graphiques 3D
- 不言original
- 2018-05-03 11:44:3910440parcourir
Cet article présente principalement Python pour dessiner des graphiques 3D, qui a une certaine valeur de référence. Maintenant, je le partage avec tout le monde. Les amis dans le besoin peuvent s'y référer
Les graphiques 3D sont utilisés dans l'analyse des données, la modélisation des données, et les graphiques. Il est largement utilisé dans des domaines tels que le traitement d'images et le traitement d'images. Ci-dessous, je vais vous présenter comment utiliser Python pour dessiner des graphiques 3D, y compris le dessin de points de dispersion 3D, de surfaces 3D, de contours 3D, de lignes droites 3D ( courbes) et texte 3D.
Travail de préparation :
Pour dessiner des graphiques 3D en python, vous utilisez toujours le module de dessin couramment utilisé matplotlib, mais vous devez installer la boîte à outils mpl_toolkits. La méthode d'installation est la suivante : entrez le. répertoire d'installation de python depuis la ligne de commande Windows Dans le dossier Scripts, exécutez : pip install --upgrade matplotlib; exécutez cette commande directement dans l'environnement Linux.
Après avoir installé ce module, vous pouvez appeler la classe mplot3d sous mpl_tookits pour dessiner des graphiques 3D.
Ce qui suit est un exemple.
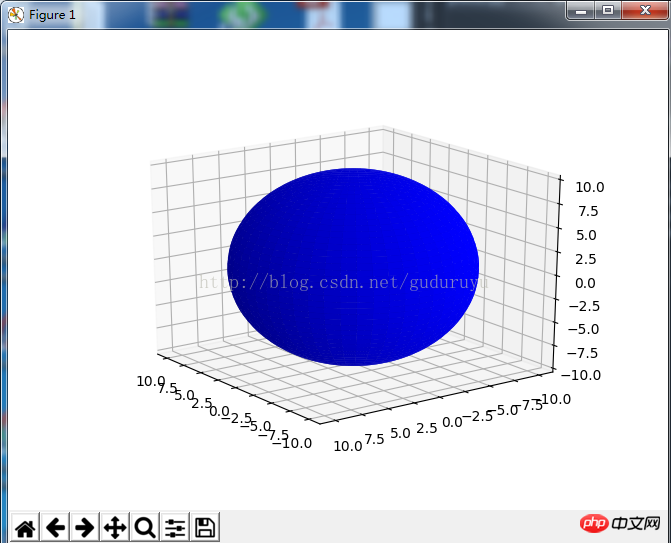
1. Dessin de la forme de la surface 3D
from mpl_toolkits.mplot3d import Axes3D
import matplotlib.pyplot as plt
import numpy as np

fig = plt.figure()
ax = fig.add_subplot(111, projection='3d')

# Make data
u = np.linspace(0, 2 * np.pi, 100)
v = np.linspace(0, np.pi, 100)
x = 10 * np.outer(np.cos(u), np.sin(v))
y = 10 * np.outer(np.sin(u), np.sin(v))
z = 10 * np.outer(np.ones(np.size(u)), np.cos(v))

# Plot the surface
ax.plot_surface(x, y, z, color='b')

plt.show()
Surface de la sphère, les résultats sont les suivants :
2. Dessin de lignes droites (courbes) 3D
import matplotlib as mpl
from mpl_toolkits.mplot3d import Axes3D
import numpy as np
import matplotlib.pyplot as plt

mpl.rcParams['legend.fontsize'] = 10

fig = plt.figure()
ax = fig.gca(projection='3d')
theta = np.linspace(-4 * np.pi, 4 * np.pi, 100)
z = np.linspace(-2, 2, 100)
r = z**2 + 1
x = r * np.sin(theta)
y = r * np.cos(theta)
ax.plot(x, y, z, label='parametric curve')
ax.legend()

plt.show()
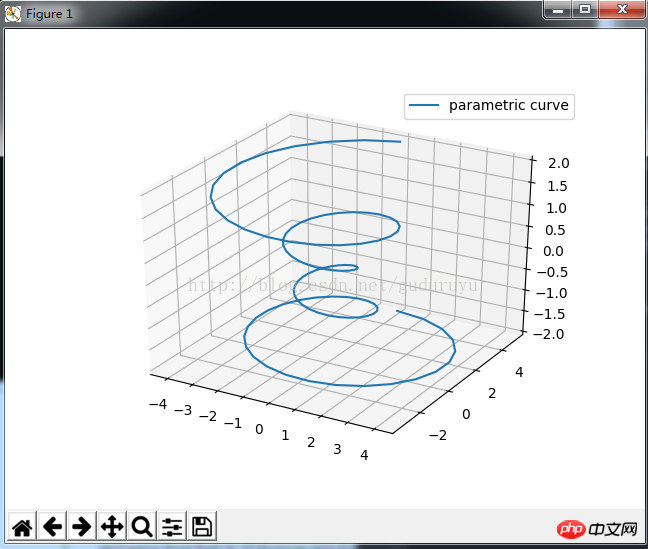
Ce code permet de dessiner une spirale Courbe 3D. Les résultats sont les suivants :
3. Dessinez des contours 3D
from mpl_toolkits.mplot3d import axes3d
import matplotlib.pyplot as plt
from matplotlib import cm

fig = plt.figure()
ax = fig.gca(projection='3d')
X, Y, Z = axes3d.get_test_data(0.05)
cset = ax.contour(X, Y, Z, zdir='z', offset=-100, cmap=cm.coolwarm)
cset = ax.contour(X, Y, Z, zdir='x', offset=-40, cmap=cm.coolwarm)
cset = ax.contour(X, Y, Z, zdir='y', offset=40, cmap=cm.coolwarm)

ax.set_xlabel('X')
ax.set_xlim(-40, 40)
ax.set_ylabel('Y')
ax.set_ylim(-40, 40)
ax.set_zlabel('Z')
ax.set_zlim(-100, 100)

plt.show()
.
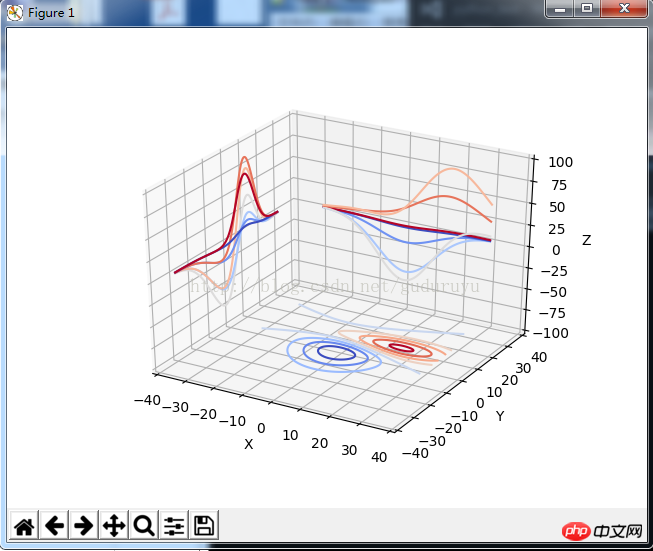
Les résultats du dessin sont les suivants :
4. Dessinez un histogramme 3D
from mpl_toolkits.mplot3d import Axes3D
import matplotlib.pyplot as plt
import numpy as np

fig = plt.figure()
ax = fig.add_subplot(111, projection='3d')
x, y = np.random.rand(2, 100) * 4
hist, xedges, yedges = np.histogram2d(x, y, bins=4, range=[[0, 4], [0, 4]])

# Construct arrays for the anchor positions of the 16 bars.
# Note: np.meshgrid gives arrays in (ny, nx) so we use 'F' to flatten xpos,
# ypos in column-major order. For numpy >= 1.7, we could instead call meshgrid
# with indexing='ij'.
xpos, ypos = np.meshgrid(xedges[:-1] + 0.25, yedges[:-1] + 0.25)
xpos = xpos.flatten('F')
ypos = ypos.flatten('F')
zpos = np.zeros_like(xpos)

# Construct arrays with the dimensions for the 16 bars.
dx = 0.5 * np.ones_like(zpos)
dy = dx.copy()
dz = hist.flatten()

ax.bar3d(xpos, ypos, zpos, dx, dy, dz, color='b', zsort='average')

plt.show()
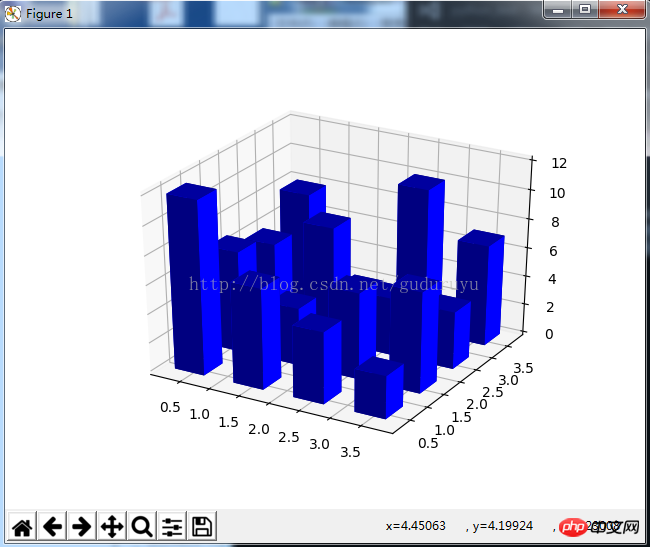
Les résultats du dessin sont les suivants :
from mpl_toolkits.mplot3d import axes3d
import matplotlib.pyplot as plt


fig = plt.figure()
ax = fig.add_subplot(111, projection='3d')

# Grab some test data.
X, Y, Z = axes3d.get_test_data(0.05)

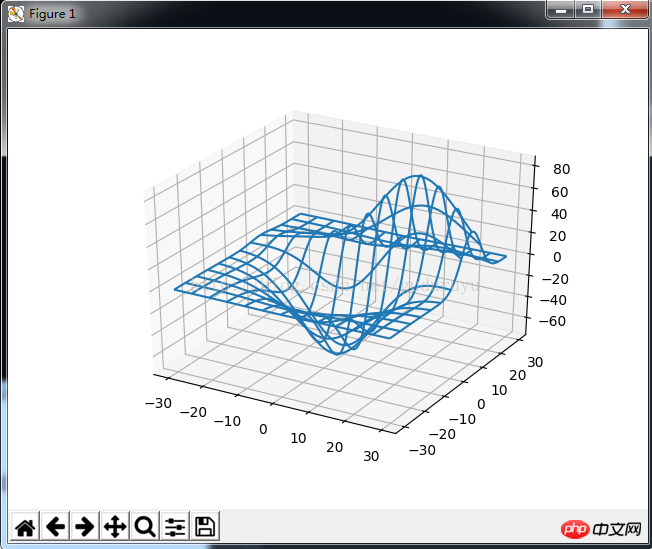
# Plot a basic wireframe.
ax.plot_wireframe(X, Y, Z, rstride=10, cstride=10)

plt.show()
. Les résultats du dessin sont les suivants :
from mpl_toolkits.mplot3d import Axes3D
import matplotlib.pyplot as plt
import numpy as np


n_radii = 8
n_angles = 36

# Make radii and angles spaces (radius r=0 omitted to eliminate duplication).
radii = np.linspace(0.125, 1.0, n_radii)
angles = np.linspace(0, 2*np.pi, n_angles, endpoint=False)

# Repeat all angles for each radius.
angles = np.repeat(angles[..., np.newaxis], n_radii, axis=1)

# Convert polar (radii, angles) coords to cartesian (x, y) coords.
# (0, 0) is manually added at this stage, so there will be no duplicate
# points in the (x, y) plane.
x = np.append(0, (radii*np.cos(angles)).flatten())
y = np.append(0, (radii*np.sin(angles)).flatten())

# Compute z to make the pringle surface.
z = np.sin(-x*y)

fig = plt.figure()
ax = fig.gca(projection='3d')

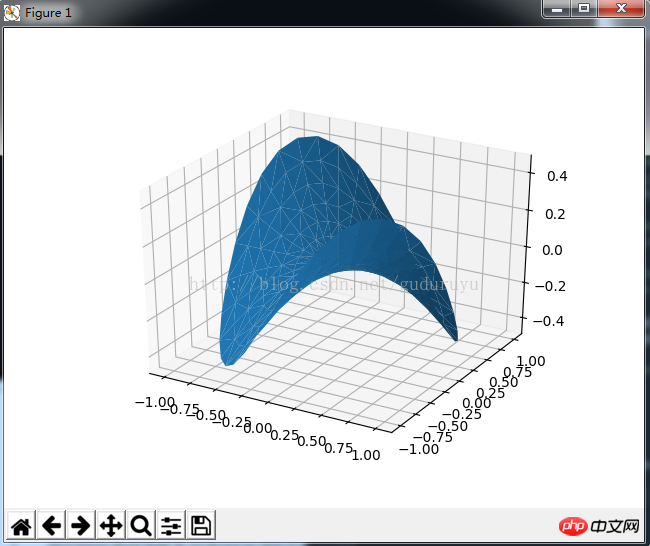
ax.plot_trisurf(x, y, z, linewidth=0.2, antialiased=True)

plt.show(
Les résultats du dessin sont les suivants :
from mpl_toolkits.mplot3d import Axes3D
import matplotlib.pyplot as plt
import numpy as np


def randrange(n, vmin, vmax):
 '''''
 Helper function to make an array of random numbers having shape (n, )
 with each number distributed Uniform(vmin, vmax).
 '''
 return (vmax - vmin)*np.random.rand(n) + vmin

fig = plt.figure()
ax = fig.add_subplot(111, projection='3d')

n = 100

# For each set of style and range settings, plot n random points in the box
# defined by x in [23, 32], y in [0, 100], z in [zlow, zhigh].
for c, m, zlow, zhigh in [('r', 'o', -50, -25), ('b', '^', -30, -5)]:
 xs = randrange(n, 23, 32)
 ys = randrange(n, 0, 100)
 zs = randrange(n, zlow, zhigh)
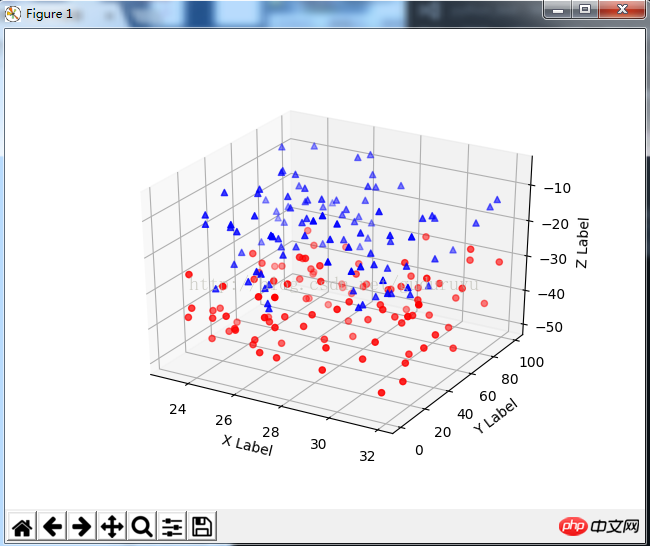
 ax.scatter(xs, ys, zs, c=c, marker=m)

ax.set_xlabel('X Label')
ax.set_ylabel('Y Label')
ax.set_zlabel('Z Label')

plt.show()
Les résultats du dessin sont les suivants :
from mpl_toolkits.mplot3d import Axes3D
import matplotlib.pyplot as plt


fig = plt.figure()
ax = fig.gca(projection='3d')

# Demo 1: zdir
zdirs = (None, 'x', 'y', 'z', (1, 1, 0), (1, 1, 1))
xs = (1, 4, 4, 9, 4, 1)
ys = (2, 5, 8, 10, 1, 2)
zs = (10, 3, 8, 9, 1, 8)

for zdir, x, y, z in zip(zdirs, xs, ys, zs):
 label = '(%d, %d, %d), dir=%s' % (x, y, z, zdir)
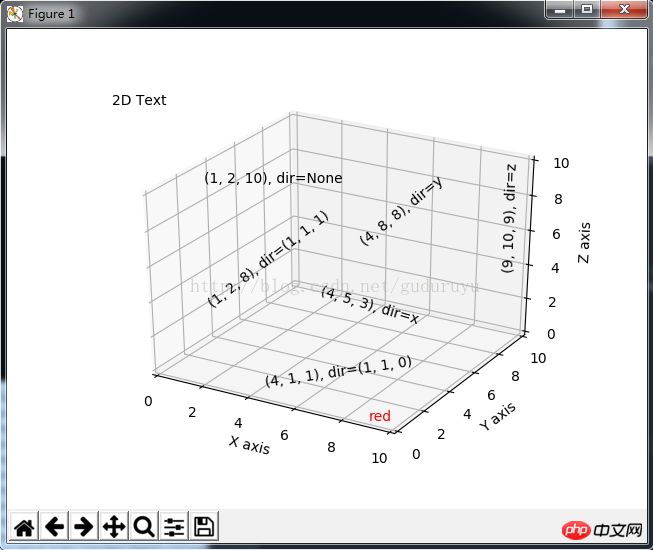
 ax.text(x, y, z, label, zdir)

# Demo 2: color
ax.text(9, 0, 0, "red", color='red')

# Demo 3: text2D
# Placement 0, 0 would be the bottom left, 1, 1 would be the top right.
ax.text2D(0.05, 0.95, "2D Text", transform=ax.transAxes)

# Tweaking display region and labels
ax.set_xlim(0, 10)
ax.set_ylim(0, 10)
ax.set_zlim(0, 10)
ax.set_xlabel('X axis')
ax.set_ylabel('Y axis')
ax.set_zlabel('Z axis')

plt.show(
Résultat du dessin Comme suit :
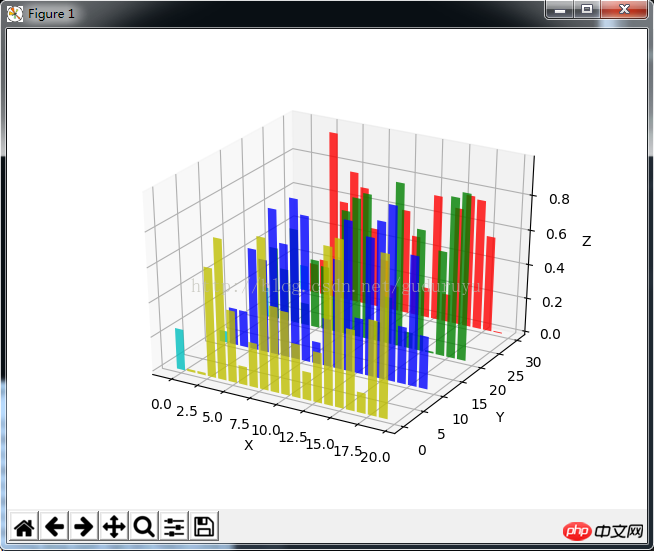
9. Graphique à barres 3D
from mpl_toolkits.mplot3d import Axes3D
import matplotlib.pyplot as plt
import numpy as np

fig = plt.figure()
ax = fig.add_subplot(111, projection='3d')
for c, z in zip(['r', 'g', 'b', 'y'], [30, 20, 10, 0]):
 xs = np.arange(20)
 ys = np.random.rand(20)

 # You can provide either a single color or an array. To demonstrate this,
 # the first bar of each set will be colored cyan.
 cs = [c] * len(xs)
 cs[0] = 'c'
 ax.bar(xs, ys, zs=z, zdir='y', color=cs, alpha=0.8)

ax.set_xlabel('X')
ax.set_ylabel('Y')
ax.set_zlabel('Z')

plt.show()
Les résultats du tirage sont les suivants :
 Recommandations associées :
Ce qui précède est le contenu détaillé de. pour plus d'informations, suivez d'autres articles connexes sur le site Web de PHP en chinois!

