Maison >développement back-end >Tutoriel Python >Comment implémenter une machine à vecteurs de support non linéaire dans TensorFlow
Comment implémenter une machine à vecteurs de support non linéaire dans TensorFlow
- 不言original
- 2018-04-28 10:18:302688parcourir
Cet article présente principalement la méthode d'implémentation de la machine à vecteurs de support non linéaire dans TensorFlow. Maintenant, je le partage avec vous et vous donne une référence. Jetons un coup d'œil ensemble
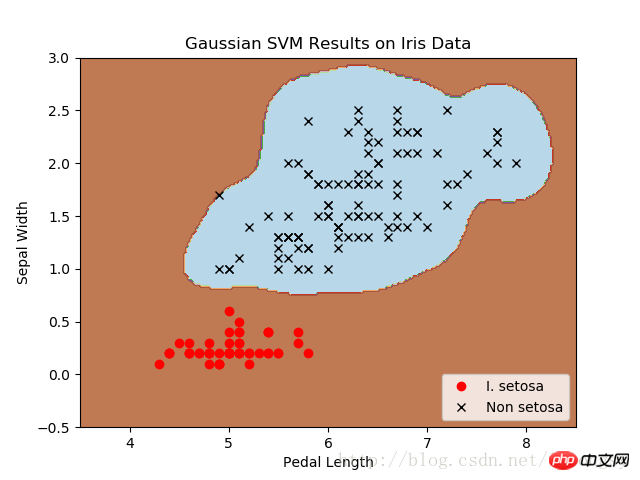
Ici, nous allons charger l'ensemble de données sur l'iris et créer un classificateur pour l'iris des montagnes (I.setosa).
# Nonlinear SVM Example
#----------------------------------
#
# This function wll illustrate how to
# implement the gaussian kernel on
# the iris dataset.
#
# Gaussian Kernel:
# K(x1, x2) = exp(-gamma * abs(x1 - x2)^2)

import matplotlib.pyplot as plt
import numpy as np
import tensorflow as tf
from sklearn import datasets
from tensorflow.python.framework import ops
ops.reset_default_graph()

# Create graph
sess = tf.Session()

# Load the data
# iris.data = [(Sepal Length, Sepal Width, Petal Length, Petal Width)]
# 加载iris数据集,抽取花萼长度和花瓣宽度,分割每类的x_vals值和y_vals值
iris = datasets.load_iris()
x_vals = np.array([[x[0], x[3]] for x in iris.data])
y_vals = np.array([1 if y==0 else -1 for y in iris.target])
class1_x = [x[0] for i,x in enumerate(x_vals) if y_vals[i]==1]
class1_y = [x[1] for i,x in enumerate(x_vals) if y_vals[i]==1]
class2_x = [x[0] for i,x in enumerate(x_vals) if y_vals[i]==-1]
class2_y = [x[1] for i,x in enumerate(x_vals) if y_vals[i]==-1]

# Declare batch size
# 声明批量大小(偏向于更大批量大小)
batch_size = 150

# Initialize placeholders
x_data = tf.placeholder(shape=[None, 2], dtype=tf.float32)
y_target = tf.placeholder(shape=[None, 1], dtype=tf.float32)
prediction_grid = tf.placeholder(shape=[None, 2], dtype=tf.float32)

# Create variables for svm
b = tf.Variable(tf.random_normal(shape=[1,batch_size]))

# Gaussian (RBF) kernel
# 声明批量大小(偏向于更大批量大小)
gamma = tf.constant(-25.0)
sq_dists = tf.multiply(2., tf.matmul(x_data, tf.transpose(x_data)))
my_kernel = tf.exp(tf.multiply(gamma, tf.abs(sq_dists)))

# Compute SVM Model
first_term = tf.reduce_sum(b)
b_vec_cross = tf.matmul(tf.transpose(b), b)
y_target_cross = tf.matmul(y_target, tf.transpose(y_target))
second_term = tf.reduce_sum(tf.multiply(my_kernel, tf.multiply(b_vec_cross, y_target_cross)))
loss = tf.negative(tf.subtract(first_term, second_term))

# Gaussian (RBF) prediction kernel
# 创建一个预测核函数
rA = tf.reshape(tf.reduce_sum(tf.square(x_data), 1),[-1,1])
rB = tf.reshape(tf.reduce_sum(tf.square(prediction_grid), 1),[-1,1])
pred_sq_dist = tf.add(tf.subtract(rA, tf.multiply(2., tf.matmul(x_data, tf.transpose(prediction_grid)))), tf.transpose(rB))
pred_kernel = tf.exp(tf.multiply(gamma, tf.abs(pred_sq_dist)))

# 声明一个准确度函数,其为正确分类的数据点的百分比
prediction_output = tf.matmul(tf.multiply(tf.transpose(y_target),b), pred_kernel)
prediction = tf.sign(prediction_output-tf.reduce_mean(prediction_output))
accuracy = tf.reduce_mean(tf.cast(tf.equal(tf.squeeze(prediction), tf.squeeze(y_target)), tf.float32))

# Declare optimizer
my_opt = tf.train.GradientDescentOptimizer(0.01)
train_step = my_opt.minimize(loss)

# Initialize variables
init = tf.global_variables_initializer()
sess.run(init)

# Training loop
loss_vec = []
batch_accuracy = []
for i in range(300):
  rand_index = np.random.choice(len(x_vals), size=batch_size)
  rand_x = x_vals[rand_index]
  rand_y = np.transpose([y_vals[rand_index]])
  sess.run(train_step, feed_dict={x_data: rand_x, y_target: rand_y})

  temp_loss = sess.run(loss, feed_dict={x_data: rand_x, y_target: rand_y})
  loss_vec.append(temp_loss)

  acc_temp = sess.run(accuracy, feed_dict={x_data: rand_x,
                       y_target: rand_y,
                       prediction_grid:rand_x})
  batch_accuracy.append(acc_temp)

  if (i+1)%75==0:
    print('Step #' + str(i+1))
    print('Loss = ' + str(temp_loss))

# Create a mesh to plot points in
# 为了绘制决策边界(Decision Boundary),我们创建一个数据点(x,y)的网格,评估预测函数
x_min, x_max = x_vals[:, 0].min() - 1, x_vals[:, 0].max() + 1
y_min, y_max = x_vals[:, 1].min() - 1, x_vals[:, 1].max() + 1
xx, yy = np.meshgrid(np.arange(x_min, x_max, 0.02),
           np.arange(y_min, y_max, 0.02))
grid_points = np.c_[xx.ravel(), yy.ravel()]
[grid_predictions] = sess.run(prediction, feed_dict={x_data: rand_x,
                          y_target: rand_y,
                          prediction_grid: grid_points})
grid_predictions = grid_predictions.reshape(xx.shape)

# Plot points and grid
plt.contourf(xx, yy, grid_predictions, cmap=plt.cm.Paired, alpha=0.8)
plt.plot(class1_x, class1_y, 'ro', label='I. setosa')
plt.plot(class2_x, class2_y, 'kx', label='Non setosa')
plt.title('Gaussian SVM Results on Iris Data')
plt.xlabel('Pedal Length')
plt.ylabel('Sepal Width')
plt.legend(loc='lower right')
plt.ylim([-0.5, 3.0])
plt.xlim([3.5, 8.5])
plt.show()

# Plot batch accuracy
plt.plot(batch_accuracy, 'k-', label='Accuracy')
plt.title('Batch Accuracy')
plt.xlabel('Generation')
plt.ylabel('Accuracy')
plt.legend(loc='lower right')
plt.show()

# Plot loss over time
plt.plot(loss_vec, 'k-')
plt.title('Loss per Generation')
plt.xlabel('Generation')
plt.ylabel('Loss')
plt.show()
Sortie :
Étape #75
Perte = -110.332
Étape #150
Perte = -222.832
Étape #225
Perte = -335.332
Étape #300
Perte = -447.832
Quatre valeurs gamma différentes (1, 10 , 25, 100) :


Diagramme des résultats du classificateur de l'iris des montagnes (I.setosa) avec différentes valeurs gamma, en utilisant SVM avec fonction de noyau gaussien.
Plus la valeur gamma est grande, plus l'impact de chaque point de données sur la limite de classification est grand.
Recommandations associées :
Méthode TensorFlow de mise en œuvre de l'entraînement aléatoire et de l'entraînement par lots
Ce qui précède est le contenu détaillé de. pour plus d'informations, suivez d'autres articles connexes sur le site Web de PHP en chinois!

