Maison >interface Web >js tutoriel >Echarts implémente un histogramme dynamique à changement de couleur
Echarts implémente un histogramme dynamique à changement de couleur
- php中世界最好的语言original
- 2018-04-19 16:43:118676parcourir
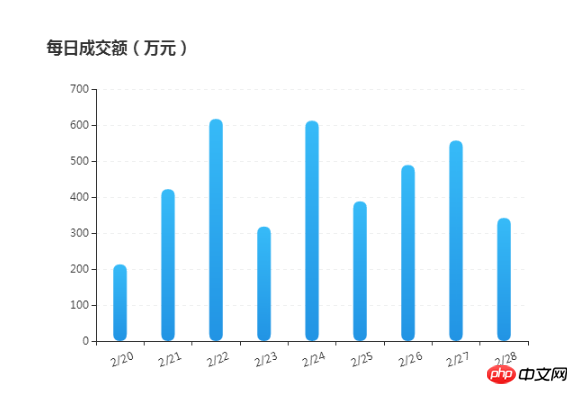
Cette fois, je vais vous présenter Echarts pour implémenter des histogrammes dynamiques à changement de couleur. Quelles sont les précautions pour qu'Echarts implémente des histogrammes dynamiques à changement de couleur. Voici des cas pratiques, jetons un coup d'œil.
Rendu :

<!DOCTYPE html>
<html>
<head>
<metacharset="utf-8">
<title>ECharts柱状图</title>
</head>
<body>
<!-- 为ECharts准备一个具备大小(宽高)的Dom -->
<pid="container"style="width: 600px;height:400px; margin: 100px auto 20px;"></p>
<scripttypet="text/javascript"src="http://libs.baidu.com/jquery/1.9.1/jquery.min.js"></script>
<scripttype="text/javascript"src="http://echarts.baidu.com/gallery/vendors/echarts/echarts-all-3.js"></script>
<scripttype="text/javascript">
var dom = document.getElementById("container");
var myChart = echarts.init(dom);
option = null;
var xAxisData = [];
var data = [];
for (var i = 20; i <29; i++) {
xAxisData.push('2' +'/'+ i);
data.push(Math.round(Math.random() * 500) + 200);
}
// 初始 option
option = {
title: {
text: '每日成交额(万元)'
},
tooltip: {
trigger: 'axis',
borderColor: '#636F7F',
borderWidth : 1,
backgroundColor : 'rgba(99,111,127,1)',
textStyle:{
color : '#ffffff',
// fontWeight : 'bold',
fontSize : 14,
},
transitionDuration : 0.6,
formatter: '{b0}<br />{c0}(万元)',
axisPointer :{
type : 'line',
lineStyle : {
color : '#05F41E',
width : 1,
type : 'solid',
},
},
// axisPointer : { // 坐标轴指示器,坐标轴触发有效
// type : 'shadow', // 默认为直线,可选为:'line' | 'shadow'
// shadowStyle :{
// color : '#D6EAFA',
// opacity : 0.5,
// }
// },
},
calculable : true,
xAxis: {
data: xAxisData.map(function(x){
return x;
}),
axisLabel: {
textStyle: {
color: '#333',
align : 'center',
baseline : 'top'
},
rotate : 20,
margin : 15,
},
},
yAxis: {
// 横向标线 默认为TRUE
splitLine: {
show: true,
},
axisLabel: {
textStyle: {
color: '#333'
}
},
type : 'value',
boundaryGap : false,
// 分隔线线的类型
splitLine: {
show: true,
lineStyle :{
color : '#EFF0F0',
type : 'dashed',
}
}
},
series: {
type: 'bar',
data: data,
barWidth: 15,
itemStyle: {
normal: {
barBorderRadius: 20,
color: new echarts.graphic.LinearGradient(0, 0, 0, 1, [{
offset: 0,
color: '#37BBF8'
}, {
offset: 1,
color: '#2294E4'
}]),
// shadowColor: 'rgba(35,149,229,0.8)',
// shadowBlur: 20,
areaStyle: {type: 'default'}
}
}
},
};
if (option && typeof option === "object") {
myChart.setOption(option, true);
}
</script>
</body>
</html>Je pense que vous maîtrisez la méthode après avoir lu le cas dans cet article. Pour un contenu plus passionnant, veuillez. faites attention aux autres sites Web chinois php Articles connexes !
Lecture recommandée :
Effet d'animation de dégradé de couleur d'arrière-plan de l'opération jQuery
Le plug-in jQuery FusionCharts dessine un diagramme circulaire
Limite de caractères d'entrée de la zone de texte de l'opération jQuery
Ce qui précède est le contenu détaillé de. pour plus d'informations, suivez d'autres articles connexes sur le site Web de PHP en chinois!
Articles Liés
Voir plus- Une analyse approfondie du composant de groupe de liste Bootstrap
- Explication détaillée du currying de la fonction JavaScript
- Exemple complet de génération de mot de passe JS et de détection de force (avec téléchargement du code source de démonstration)
- Angularjs intègre l'interface utilisateur WeChat (weui)
- Comment basculer rapidement entre le chinois traditionnel et le chinois simplifié avec JavaScript et l'astuce permettant aux sites Web de prendre en charge le basculement entre les compétences en chinois simplifié et traditionnel_javascript

