Maison >développement back-end >Tutoriel Python >Comment identifier la linéarité dans la programmation Python
Comment identifier la linéarité dans la programmation Python
- 零到壹度original
- 2018-03-31 11:36:443248parcourir
Cet article vous explique principalement comment distinguer la linéarité dans la programmation Python. Les amis qui en ont besoin peuvent y jeter un œil.
"""
Author: Victoria
Created on: 2017.9.15 11:45
"""
import pandas as pd
import numpy as np
import matplotlib.pyplot as plt
def LDA(X0, X1):
    """
    Get the optimal params of LDA model given training data.
    Input:
        X0: np.array with shape [N1, d]
        X1: np.array with shape [N2, d]
    Return:
        omega: np.array with shape [1, d]. Optimal params of LDA.
    """
    #shape [1, d]
    mean0 = np.mean(X0, axis=0, keepdims=True)
    mean1 = np.mean(X1, axis=0, keepdims=True)
    Sw = (X0-mean0).T.dot(X0-mean0) + (X1-mean1).T.dot(X1-mean1)
    omega = np.linalg.inv(Sw).dot((mean0-mean1).T)
    return omega
if __name__=="__main__":
    #read data from xls
    work_book = pd.read_csv("../data/watermelon_3a.csv", header=None)
    positive_data = work_book.values[work_book.values[:, -1] == 1.0, :]
    negative_data = work_book.values[work_book.values[:, -1] == 0.0, :]
    print (positive_data)
    #LDA
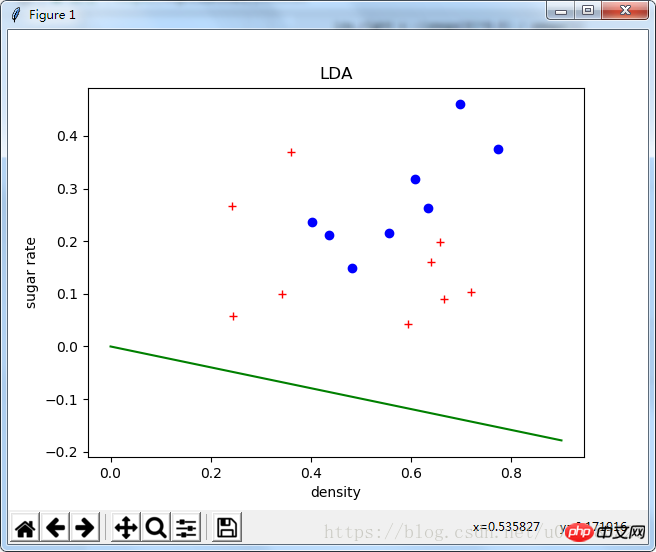
    omega = LDA(negative_data[:, 1:-1], positive_data[:, 1:-1])
    #plot
    plt.plot(positive_data[:, 1], positive_data[:, 2], "bo")
    plt.plot(negative_data[:, 1], negative_data[:, 2], "r+")
    lda_left = 0
    lda_right = -(omega[0]*0.9) / omega[1]
    plt.plot([0, 0.9], [lda_left, lda_right], 'g-')
    plt.xlabel('density')
    plt.ylabel('sugar rate')
    plt.title("LDA")
    plt.show()
Recommandations associées :
Une brève introduction au linéaire Tutoriel d'analyse discriminante
Analyse discriminante linéaire
Ce qui précède est le contenu détaillé de. pour plus d'informations, suivez d'autres articles connexes sur le site Web de PHP en chinois!
Déclaration:
Le contenu de cet article est volontairement contribué par les internautes et les droits d'auteur appartiennent à l'auteur original. Ce site n'assume aucune responsabilité légale correspondante. Si vous trouvez un contenu suspecté de plagiat ou de contrefaçon, veuillez contacter admin@php.cn
Article précédent:Comment convertir str et list l'un en l'autre en pythonArticle suivant:Comment convertir str et list l'un en l'autre en python

