
Maison >Opération et maintenance >exploitation et maintenance Linux >Statistiques et affichage de l'état du système Linux
Statistiques et affichage de l'état du système Linux
- 巴扎黑original
- 2017-06-23 13:50:253722parcourir
Répertoire de cet article :
10.1 La signification et l'explication de /proc
10.2 Afficher les informations sur le processus
10.2.1 Commande pstree
10.2.2 commande ps
10.2.3 problème grep après ps
10.2.4 Commandes top, htop et iftop
10.3 Commande vmstat
10.4 Commande iostat
10.5 Commande sar
10.5.1 Statistiques d'utilisation du processeur
10.5.2 Statistiques d'utilisation de la mémoire
10.5.3 Statistiques du trafic réseau
10.5.4 Afficher l'état de la file d'attente
10.5. 5 Situation des E/S du disque de statistiques
10.6 commande gratuite
Écrit devant : Cet article suppose que vous Il a été écrit avec la base théorique du processus, de la mémoire et du CPU. Les différents états impliqués dans l'article ne donnent que des explications simples sans expliquer leur signification. Si vous ne comprenez pas ces choses théoriques, cet article peut le faire. facile à lire directement. Pensez à la croix dans le coin supérieur droit. Concernant ces théories, vous pouvez lire mon autre article :
10.1 La signification et l'explication de /proc
Afficher différents statuts sous Linux. L'essence est de visualiser les éléments de la structure de données des processus concernés dans le noyau, de les formater via des outils et de les afficher . Cependant, les données du noyau ne peuvent pas être visualisées ou modifiées à volonté, du moins pas directement. Par conséquent, le pseudo système de fichiers /proc apparaît sous Linux, qui est une interface qui permet un accès externe et la modification de divers attributs ou états dans le noyau.
Sous /proc, les informations de données propres au noyau, les informations de données indépendantes de chaque processus, les informations statistiques, etc. sont enregistrées. La plupart des fichiers sont en lecture seule et ne peuvent pas être modifiés, même pour root, à l'exception de /proc/sys. La raison en sera expliquée plus tard.
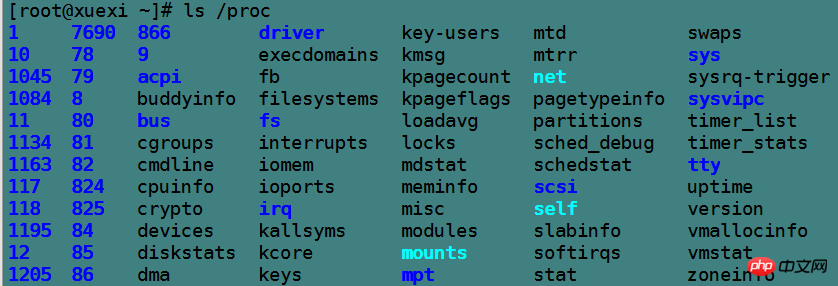
Le répertoire nommé numériquement correspond au numéro pid de chaque processus, et les fichiers à l'intérieur enregistrent les informations de données actuelles du processus, et sont tous en lecture seule, tels. comme le fichier cmdline qui enregistre les informations de commande, les informations cpuset sur le processeur utilisé par le processus, le fichier mem d'informations sur la mémoire occupée par le processus, le fichier io d'informations IO du processus et d'autres fichiers d'informations divers.
[root@xuexi ~]# ls /proc/6982attr       clear_refs       cpuset   fd      loginuid   mounts      numa_maps      pagemap      schedstat  stat     task
autogroup  cmdline          cwd      fdinfo  maps       mountstats  oom_adj        personality  sessionid  statm    wchan
auxv       comm             environ  io      mem        net         oom_score      root         smaps      status
cgroup     coredump_filter  exe      limits  mountinfo  ns          oom_score_adj  sched        stack      syscall
非数字命名的目录各有用途,例如bus表示总线信息,driver表示驱动信息,fs表示文件系统特殊信息,net表示网络信息,tty表示跟物理终端有关的信息,最特殊的两个是/proc/self和/proc/sys。
先说/proc/self目录,它表示的是当前正在访问/proc目录的进程,因为/proc目录是内核数据向外记录的接口,所以当前访问/proc目录的进程表示的就是当前cpu正在执行的进程。如果执行cat /proc/self/cmdline,会发现其结果总是该命令本身,因为cat是手动敲入的命令,它是重要性进程,cpu会立即执行该命令。
再说/proc/sys这个目录,该目录是为管理员提供用来修改内核运行参数的,所以该目录中的文件对root都是可写的,例如管理数据包转发功能的/proc/sys/net/ipv4/ip_forward文件。使用sysctl命令修改内核运行参数,其本质也是修改/proc/sys目录中的文件。
10.2 查看进程信息
10.2.1 pstree命令
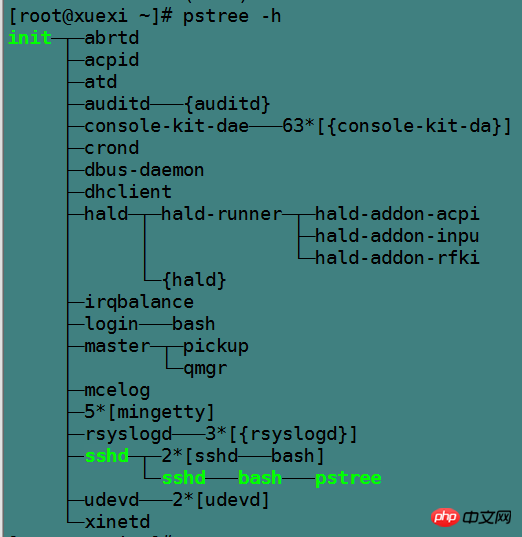
pstree命令将以树的形式显示进程信息,默认树的分支是收拢的,也不显示pid,要显示这些信息需要指定对应的选项。
pstree [-a] [-c] [-h] [-l] [-p] [pid]

选项说明:-a:显示进程的命令行-c:展开分支-h:高亮当前正在运行的进程及其父进程-p:显示进程pid,此选项也将展开分支-l:允许显示长格式进程。默认在显示结果中超过132个字符时将截断后面的字符。
例如:
10.2.2 ps命令
ps命令查看当前这一刻的进程信息,注意查看的是静态进程信息,要查看随时刷新的动态进程信息(如windows的进程管理器那样,每秒刷新一次),使用top或htop命令。
这个命令的man文档及其复杂,它同时支持3种类型的选项:GUN/BSD/UNIX,不同类型的选项其展示的信息格式不一样。有些加了"-"的是SysV风格 的选项,不加"-"的是BSD选项,加不加"-"它们的意义是不一样的,例如ps aux 和ps -aux是不同的。
其实只需掌握少数几个选项即可,关键的是要了解ps显示出的进程信息中每一列代表什么属性。
对于BSD风格的选项,只需知道一个用法ps aux足以,选项"a"表示列出依赖于终端的进程,选项"x"表示列出不依赖于终端的进程,所以两者结合就表示列出所有进程,选项"u"表示展现的进程信息是以用户为导向的,不用管它什么是以用户为导向,用ps aux就没错。
[root@server2 ~]# ps aux | tailUSER        PID %CPU %MEM    VSZ   RSS TTY      STAT START   TIME COMMAND
root       1340  0.0  0.0  27176   588 ?        Ss   20:30   0:00 /usr/sbin/xinetd -stayalive -pidfile /var/run/xinetd.pid
root       2266  0.0  0.1  93212  2140 ?        Ss   20:30   0:00 /usr/libexec/postfix/master -wpostfix    2268  0.0  0.2  93384  3992 ?        S    20:30   0:00 qmgr -l -t unix -u
postfix    2306  0.0  0.2  93316  3972 ?        S    20:31   0:00 pickup -l -t unix -u
root       2307  0.0  0.2 145552  5528 ?        Ss   20:31   0:00 sshd: root@pts/0root       2309  0.0  0.0      0     0 ?        S<   20:31   0:00 [kworker/3:1H]
root       2310  0.0  0.1 116568  3184 pts/0    Ss   20:31   0:00 -bash
root       2352  0.0  0.0      0     0 ?        S<   20:31   0:00 [kworker/1:2H]
root       2355  0.0  0.0 139492  1632 pts/0    R+   20:34   0:00 ps aux
root       2356  0.0  0.0 107928   676 pts/0    R+   20:34   0:00 tail
各列的意义:
%CPU:表示CPU占用百分比,注意,CPU的衡量方式是占用时间,所以百分比的计算方式是"进程占用cpu时间/cpu总时间",而不是cpu工作强度的状态。
%MEM:表示各进程所占物理内存百分比。
VSZ:表示各进程占用的虚拟内存,也就是其在线性地址空间中实际占用的内存。单位为kb。
RSS:表示各进程占用的实际物理内存。单位为Kb。
TTY:表示属于哪个终端的进程,"?"表示不依赖于终端的进程。
STAT:进程所处的状态。
D:不可中断睡眠
R:运行中或等待队列中的进程(running/runnable)
S:可中断睡眠
T:进程处于stopped状态
Z:僵尸进程
对于BSD风格的ps选项,进程的状态还会显示下面几个组合信息。
<:高优先级进程
N:低优先级进程
L:该进程在内存中有被锁定的页
s:表示该进程是session leader,即进程组的首进程。例如管道左边的进程,shell脚本中的shell进程
l:表示该进程是一个线程
+:表示是前段进程。前段进程一般来说都是依赖于终端的
START:表示进程是何时被创建的
TIME:表示各进程占用的CPU时间
COMMAND:表示进程的命令行。如果是内核线程,则使用方括号"[]"包围
注意到了没,ps aux没有显示出ppid。
另外常用的ps选项是ps -elf。其中"-e"表示输出全部进程信息,"-f"和"-l"分别表示全格式输出和长格式输出。全格式会输出cmd的全部参数。
[root@server2 ~]# ps -lf
F S UID         PID   PPID  C PRI  NI ADDR SZ WCHAN  STIME TTY          TIME CMD4 S postfix    2306   2266  0  80   0 - 23329 ep_pol 20:31 ?        00:00:00 pickup -l -t unix -u4 S root       2307   1141  0  80   0 - 36388 poll_s 20:31 ?        00:00:00 sshd: root@pts/01 S root       2309      2  0  60 -20 -     0 worker 20:31 ?        00:00:00 [kworker/3:1H]4 S root       2310   2307  0  80   0 - 29142 wait   20:31 pts/0    00:00:00 -bash1 S root       2433      2  0  60 -20 -     0 worker 21:21 ?        00:00:00 [kworker/1:1H]1 S root       2479      2  0  80   0 -     0 worker 21:25 ?        00:00:00 [kworker/1:0]1 S root       2503      2  0  60 -20 -     0 worker 21:28 ?        00:00:00 [kworker/1:2H]1 S root       2532      2  0  80   0 -     0 worker 21:30 ?        00:00:00 [kworker/1:1]0 R root       2539   2310  0  80   0 - 34873 -      21:33 pts/0    00:00:00 ps -elf0 S root       2540   2310  0  80   0 - 26982 pipe_w 21:33 pts/0    00:00:00 tail
各列的意义:
F:程序的标志位。0表示该程序只有普通权限,4表示具有root超级管理员权限,1表示该进程被创建的时候只进行了fork,没有进行exec
S:进程的状态位,注意ps选项加了"-"的是非BSD风格选项,不会有"s""<""N""+"等的状态标识位
C:CPU的百分比,注意衡量方式是时间
PRI:进程的优先级,值越小,优先级越高,越早被调度类选中运行
NI:进程的NICE值,值为-20到19,影响优先级的方式是PRI(new)=PRI(old)+NI,所以NI为负数的时候,越小将导致进程优先级越高。
:但要注意,NICE值只能影响非实时进程。
ADDR:进程在物理内存中哪个地方。
SZ:进程占用的实际物理内存
WCHAN:若进程处于睡眠状态,将显示其对应内核线程的名称,若进程为R状态,则显示"-"
10.2.3 ps后grep问题
在ps后加上grep筛选目标进程时,总会发现grep自身进程也被显示出来。先解释下为何会如此。
[root@xuexi ~]# ps aux | grep "crond"root       1425  0.0  0.1 117332  1276 ?        Ss   Jun10   0:00 crond
root       8275  0.0  0.0 103256   856 pts/2    S+   17:07   0:00 grep crond
通过管道将ps结果传递给grep时,管道协调了ps和grep两进程间通信,但管道的本质是进程间数据传递。管道左边的输出数据放入内存,由管道右边的进程读取。假如划分的内存不足以完全存放输出数据,则管道左边的进程将一直等待,直到管道右边取出内存中一部分的数据以让管道左边的进程继续输出,而管道右边的进程在管道左边的进程启动后也立刻启动了,但是它一直处于等待状态,等待接收管道传递来的数据(就像是平时执行命令时不给输入文件将会一直等待输入一样)。
也就是说,管道左右两端的进程是同时被创建的(不考虑父进程创建进程消耗的那点时间),但数据传输是有先后顺序的,左边先传,右边后收,所以可能会造成交叉的情况,左边还没执行完,就捕获到了右边的进程信息。在此处体现在ps还没有统计完进程信息时,grep进程就已经被ps抓到了。
要将grep自身进程排除在结果之外,方法有二:
[root@xuexi ~]# ps aux | grep "crond" | grep -v "grep"   # 使用-v将grep自己筛选掉
root       1425  0.0  0.1 117332  1276 ?        Ss   Jun10   0:00 crond

[root@xuexi ~]# ps aux | grep "cron[d]"root       1425  0.0  0.1 117332  1276 ?        Ss   Jun10   0:00 crond
第二种方法能成功是因为grep进程被ps捕获时的结果是"grep cron[d]",而使用cron[d]匹配时,它将只能匹配crond,所以"grep cron[d]"被筛选掉了。其实加上其他字符将更容易理解。
[root@xuexi ~]# ps aux | grep "cron[dabc]"root 1425 0.0 0.1 117332 1276 ? Ss Jun10 0:00 crond
10.2.4 top、htop以及iftop命令
top命令查看动态进程状态,默认每5秒刷新一次。
top选项说明:
-d:指定top刷新的时间间隔,默认是5 秒-b:批处理模式,每次刷新分批显示-n:指定top刷新几次就退出,可以配合-b使用-p:指定监控的pid,指定方式为-pN1 -pN2 ...或-pN1, N2 [,...]-u:指定要监控的用户的进程,可以是uid也可以是user_name
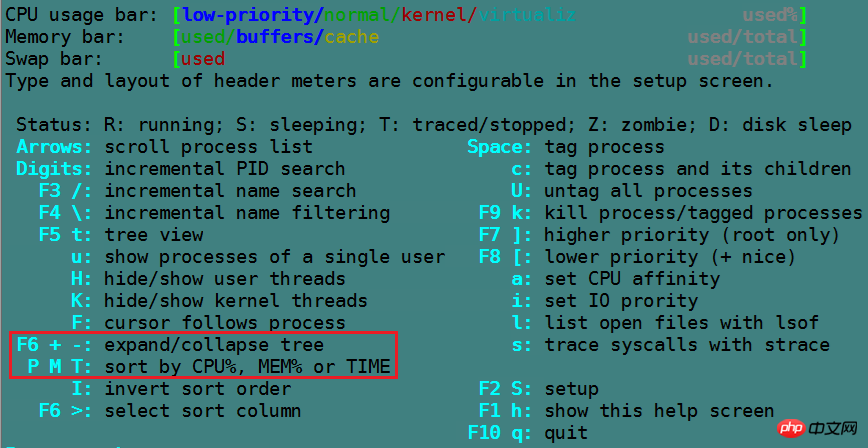
在top动态模式下,按下各种键可以进行不同操作。使用"h"或"?"可以查看相关键的说明。
1 :(数字一)表示是否要在top的头部显示出多个cpu信息
H :表示是否要显示线程,默认不显示
c,S : c表示是否要展开进程的命令行,S表示显示的cpu时间是否是累积模式,cpu累积模式下已死去的子进程cpu时间会累积到父进程中
x,y :x高亮排序的列,y表示高亮running进程
u :仅显示指定用户的进程
n or #:设置要显示最大的进程数量
k :杀进程
q :退出top
P :以CPU 的使用资源排序显示
M :以Memory 的使用资源排序显示
N :以PID 来排序
以下是top的一次结果。
[root@xuexi ~]# toptop - 17:43:44 up 1 day, 14:16,  2 users,  load average: 0.10, 0.06, 0.01
Tasks: 156 total,   1 running, 155 sleeping,   0 stopped,   0 zombie
Cpu0  :  0.0%us,  0.0%sy,  0.0%ni,100.0%id,  0.0%wa,  0.0%hi,  0.0%si,  0.0%st
Cpu1  :  0.0%us,  0.0%sy,  0.0%ni, 99.7%id,  0.0%wa,  0.0%hi,  0.3%si,  0.0%st
Cpu2  :  0.0%us,  0.0%sy,  0.0%ni,100.0%id,  0.0%wa,  0.0%hi,  0.0%si,  0.0%st
Cpu3  :  0.3%us,  0.0%sy,  0.0%ni, 99.7%id,  0.0%wa,  0.0%hi,  0.0%si,  0.0%st
Mem:   1004348k total,   417928k used,   586420k free,    52340k buffers
Swap:  2047996k total,        0k used,  2047996k free,   243800k cached

   PID USER      PR  NI  VIRT  RES  SHR S %CPU %MEM    TIME+  COMMAND
     1 root      20   0 19364 1444 1132 S  0.0  0.1   0:00.96 init
     2 root      20   0     0    0    0 S  0.0  0.0   0:00.00 kthreadd
     3 root      RT   0     0    0    0 S  0.0  0.0   0:01.28 migration/0
     4 root      20   0     0    0    0 S  0.0  0.0   0:00.59 ksoftirqd/0
     5 root      RT   0     0    0    0 S  0.0  0.0   0:00.00 stopper/0
第1行:和w命令的第一行一样,也和uptime命令的结果一样。此行各列分别表示"当前时间"、"已开机时长"、"当前在线用户"、"前1、5、15分钟平均负载率"。
第2行:分别表示总进程数、running状态的进程数、睡眠状态的进程数、停止状态进程数、僵尸进程数。
第3-6行:每颗cpu的状况。
us = user mode
sy = system mode
ni = low priority user mode (nice)(用户空间中低优先级进程的cpu占用百分比)
id = idle task
wa = I/O waiting
hi = servicing IRQs(不可中断睡眠,hard interruptible)
si = servicing soft IRQs(可中断睡眠,soft interruptible)
st = steal (time given to other DomU instances)(被偷走的cpu时间,一般被虚拟化软件偷走)
第7-8行:从字面意思理解即可。
VIRT:虚拟内存总量
RES:实际内存总量
SHR:共享内存量
TIME:进程占用的cpu时间(若开启了时间累积模式,则此处显示的是累积时间)
top命令虽然非常强大,但是太老了。所以有了新生代的top命令htop。htop默认没有安装,需要手动安装。
[root@xuexi ~]# yum -y install htop
htop可以使用鼠标完成点击选中。其他使用方法和top类似,使用h查看各按键意义即可。
iftop用于动态显示网络接口的数据流量。用法也很简单,按下h键即可获取帮助。
10.3 vmstat命令
注意vmstat的第一次统计是自开机起的平均值信息,从第二次开始的统计才是指定刷新时间间隔内的资源利用信息,若不指定刷新时间间隔,则默认只显示一次统计信息。
vmstat [-d] [delay [ count]]
vmstat [-f]

选项说明:-f:统计自开机起fork的次数。包括fork、clone、vfork的次数。但不包括exec次数。-d:显示磁盘统计信息。
delay:刷新时间间隔,若不指定,则只统计一次信息就退出vmstat。
count:总共要统计的次数。
例如,只统计一次信息。
[root@xuexi ~]# vmstat
procs -----------memory---------- ---swap-- -----io---- --system-- -----cpu-----
 r  b   swpd   free   buff  cache   si   so    bi    bo   in   cs us sy id wa st 0  0      0 583692  52684 244200    0    0     5     3    4    5  0  0 100  0  0
其中各列的意义如下:
Procs
r: 等待队列中的进程数
b: 不可中断睡眠的进程数
Memory
swpd: 虚拟内存使用总量
free: 空闲内存量
buff: buffer占用的内存量(buffer用于缓冲写)
cache: cache占用的内存量(cache用于缓存读,谐音"快取",即为了加快取数据的速度)
Swap
si:从磁盘加载到swap分区的数据流量,单位为"kb/s"
so: 从swap分区写到磁盘的数据流量,单位为"kb/s"
IO
bi: 从块设备接受到数据的速率,单位为blocks/s
bo: 发送数据到块设备的速率,单位为blocks/s
System
in: 每秒中断数,包括时钟中断数量
cs: 每秒上下文切换次数
CPU:统计的是cpu时间百分比,具体信息和top的cpu统计列一样
us: Time spent running non-kernel code. (user time, including nice time)
sy: Time spent running kernel code. (system time)
id: Time spent idle. Prior to Linux 2.5.41, this includes IO-wait time.
wa: Time spent waiting for IO. Prior to Linux 2.5.41, included in idle.
st: Time stolen from a virtual machine. Prior to Linux 2.6.11, unknown.
还可以统计磁盘的IO信息。统计信息的结果很容易看懂,所以略过。
10.4 iostat命令
iostat主要统计磁盘或分区的整体使用情况。也可以输出cpu信息,甚至是NFS网络文件系统的信息。同vmstat/sar一样,第一次统计的都是自系统开机起的平均统计信息。
iostat [ -c ] [ -d ] [ -n -h ][ -k | -m ] [ -p [device][,...] ] [ interval [ count ] ]

选项说明:-c:统计cpu信息-d:统计磁盘信息-n:统计NFS文件系统信息-h:使NFS统计信息更人类可读化-k:指定以kb/s为单位显示-m:指定以mb/s为单位显示-p:指定要统计的设备名称-y:指定不显示第一次统计信息,即不显示自开机起的统计信息。
interval:刷新时间间隔
count:总统计次数
例如:
[root@xuexi ~]# iostat
Linux 2.6.32-504.el6.x86_64 (xuexi.longshuai.com)       06/11/2017      _x86_64_        (4 CPU)

avg-cpu:  %user   %nice %system %iowait  %steal   %idle           0.01    0.00    0.03    0.01    0.00   99.96Device:            tps   Blk_read/s   Blk_wrtn/s   Blk_read   Blk_wrtn
sda               0.58        39.44        23.14    5557194    3259968sdb               0.00         0.03         0.00       4256          0
各列的意义都很清晰,从字面即可理解。
tps:每秒transfer速率(transfers per second),一次对物理设备的IO请求为一个transfer,但多个逻辑请求可能只组成一个transfer
Blk_read/s:每秒读取的block数量
Blk_wrtn/s:每秒写入的block总数
Blk_read:读取的总block数量
Blk_wrtn:写入的总block数量
10.5 sar命令
sar是一个非常强大的性能分析工具,它可以获取系统的cpu/等待队列/磁盘IO/内存/网络等性能指标。
功能多的必然结果是选项多,应用复杂,但只要知道一些常用的选项足以。
sar [options] [-o filename] [delay [count] ]
选项说明:-A:显示系统所有资源运行状况-b:显示磁盘IO和tranfer速率信息,和iostat的信息一样,是总体IO统计信息-d:显示磁盘在刷新时间间隔内的活跃情况,可以指定一个或多个设备,和-b不同的是,它显示的是单设备的IO、transfer信息。
  :建议配合-p使用显示友好的设备名,否则默认显示带主次设备号的设备名-P:显示指定的某颗或某几颗cpu的使用情况。指定方式为,-P 0,1,2,3或ALL。-u:显示每颗cpu整体平均使用情况。-u和-P的区别通过下面的示例很容易区分。-r:显示内存在刷新时间间隔内的使用情况-n:显示网络运行状态。后可接DEV/NFS/NFSD/FULL等多种参数。
  :DEV表示显示网路接口信息,NFS和NFSD分别表示显示NFS客户端服务端的流量信息,FULL表示显示所有信息。-q:显示等待队列大小-o filename:将结果存入到文件中
delay:状态刷新时间间隔
count:总共刷新几次
10.5.1 统计cpu使用情况
[root@server2 ~]# sar -P ALL 1 2Linux 3.10.0-327.el7.x86_64 (server2.longshuai.com)     06/20/2017      _x86_64_        (4 CPU)01:18:49 AM     CPU     %user     %nice   %system   %iowait    %steal     %idle01:18:50 AM     all      0.00      0.00      0.25      0.00      0.00     99.7501:18:50 AM       0      0.00      0.00      0.00      0.00      0.00    100.0001:18:50 AM       1      0.00      0.00      0.00      0.00      0.00    100.0001:18:50 AM       2      0.00      0.00      0.00      0.00      0.00    100.0001:18:50 AM       3      0.00      0.00      0.00      0.00      0.00    100.00
 01:18:50 AM     CPU     %user     %nice   %system   %iowait    %steal     %idle01:18:51 AM     all      0.00      0.00      0.00      0.00      0.00    100.0001:18:51 AM       0      0.00      0.00      0.00      0.00      0.00    100.0001:18:51 AM       1      0.00      0.00      0.99      0.00      0.00     99.0101:18:51 AM       2      0.00      0.00      0.00      0.00      0.00    100.0001:18:51 AM       3      0.00      0.00      0.00      0.00      0.00    100.00
 Average:        CPU     %user     %nice   %system   %iowait    %steal     %idle
Average:        all      0.00      0.00      0.12      0.00      0.00     99.88Average:          0      0.00      0.00      0.00      0.00      0.00    100.00Average:          1      0.00      0.00      0.50      0.00      0.00     99.50Average:          2      0.00      0.00      0.00      0.00      0.00    100.00Average:          3      0.00      0.00      0.00      0.00      0.00    100.00
各列的意义就不再赘述了,在前面几个信息查看命令已经解释过多次了。
在上面的例子中,统计了所有cpu(0,1,2,3共4颗)每秒的状态信息,每秒还进行了一次汇总,即all,最后还对每颗cpu和汇总all计算了平均值。而我们真正需要关注的是最后的average部分的idle值,idle越小,说明cpu处于空闲时间越少,该颗或整体cpu使用率就越高。
或者直接对整体进行统计。如下:
[root@server2 ~]# sar -u 1 2Linux 3.10.0-327.el7.x86_64 (server2.longshuai.com) 06/20/2017 _x86_64_ (4 CPU)01:18:37 AM CPU %user %nice %system %iowait %steal %idle01:18:39 AM all 0.00 0.00 0.00 0.00 0.00 100.0001:18:40 AM all 0.00 0.00 0.23 0.00 0.00 99.77Average: all 0.00 0.00 0.12 0.00 0.00 99.88
10.5.2 统计内存使用情况
[root@server2 ~]# sar -r 1 2Linux 3.10.0-327.el7.x86_64 (server2.longshuai.com) 06/20/2017 _x86_64_ (4 CPU)01:49:04 AM kbmemfree kbmemused %memused kbbuffers kbcached kbcommit %commit kbactive kbinact kbdirty01:49:05 AM 1315968 552720 29.58 932 319888 225164 5.75 282760 85740 001:49:06 AM 1315984 552704 29.58 932 319888 225164 5.75 282760 85740 0Average: 1315976 552712 29.58 932 319888 225164 5.75 282760 85740 0
其中kbdirty表示内存中脏页的大小,即内存中还有多少应该刷新到磁盘的数据。
10.5.3 统计网络流量
第一种方法是查看/proc/net/dev文件。
[root@server2 ~]# cat /proc/net/dev
Inter-|   Receive                                                |  Transmit
 face |bytes    packets errs drop fifo frame compressed multicast|bytes    packets errs drop fifo colls carrier compressed
  eth0:  209644    1834    0    0    0     0          0         0   981664    1679    0    0    0     0       0          0lo:     340       4    0    0    0     0          0         0      340       4    0    0    0     0       0          0
关注列:receive和transmit分别表示收包和发包,关注每个网卡的bytes即可获得网卡的情况。写一个脚本计算每秒的差值即为网络流量。
或者使用sar -n命令统计网卡接口的数据。
[root@server2 ~]# sar -n DEV 1 2Linux 3.10.0-327.el7.x86_64 (server2.longshuai.com)     06/20/2017      _x86_64_        (4 CPU)01:51:11 AM     IFACE   rxpck/s   txpck/s    rxkB/s    txkB/s   rxcmp/s   txcmp/s  rxmcst/s01:51:12 AM      eth0      0.00      0.00      0.00      0.00      0.00      0.00      0.0001:51:12 AM        lo      0.00      0.00      0.00      0.00      0.00      0.00      0.0001:51:12 AM     IFACE   rxpck/s   txpck/s    rxkB/s    txkB/s   rxcmp/s   txcmp/s  rxmcst/s01:51:13 AM      eth0      0.99      0.99      0.06      0.41      0.00      0.00      0.0001:51:13 AM        lo      0.00      0.00      0.00      0.00      0.00      0.00      0.00Average:        IFACE   rxpck/s   txpck/s    rxkB/s    txkB/s   rxcmp/s   txcmp/s  rxmcst/s
Average:         eth0      0.50      0.50      0.03      0.21      0.00      0.00      0.00Average:           lo      0.00      0.00      0.00      0.00      0.00      0.00      0.00
各列的意义如下:
rxpck/s:每秒收到的包数量
txpck/s:每秒发送的包数量
rxkB/s:每秒收到的数据,单位为kb
txkB/s:每秒发送的数据,单位为kb
rxcmp/s:每秒收到的压缩后的包数量
txcmp/s:每秒发送的压缩后的包数量
rxmcst/s:每秒收到的多播包数量
10.5.4 查看队列情况
[root@server2 ~]# sar -q
Linux 3.10.0-327.el7.x86_64 (server2.longshuai.com)     06/20/2017      _x86_64_        (4 CPU)12:00:01 AM   runq-sz  plist-sz   ldavg-1   ldavg-5  ldavg-15   blocked12:10:01 AM         0       446      0.01      0.02      0.05         012:20:01 AM         0       445      0.02      0.03      0.05         012:30:01 AM         0       446      0.00      0.01      0.05         0Average:            0       446      0.01      0.02      0.05         0
每列意义解释:
runq-sz:等待队列的长度,不包括正在运行的进程
plist-sz:任务列表中的进程数量,即总任务数
ldavg-N:过去1分钟、5分钟、15分钟内系统的平均哎
blocked:当前因为IO等待被阻塞的任务数量
10.5.5 统计磁盘IO情况
[root@server2 ~]# sar -d -p 1 2Linux 3.10.0-327.el7.x86_64 (server2.longshuai.com)     06/20/2017      _x86_64_        (4 CPU)
12:53:06 AM       DEV       tps  rd_sec/s  wr_sec/s  avgrq-sz  avgqu-sz     await     svctm     %util12:53:07 AM       sda      0.00      0.00      0.00      0.00      0.00      0.00      0.00      0.00
 12:53:07 AM       DEV       tps  rd_sec/s  wr_sec/s  avgrq-sz  avgqu-sz     await     svctm     %util12:53:08 AM       sda      0.00      0.00      0.00      0.00      0.00      0.00      0.00      0.00Average:          DEV       tps  rd_sec/s  wr_sec/s  avgrq-sz  avgqu-sz     await     svctm     %util
Average:          sda      0.00      0.00      0.00      0.00      0.00      0.00      0.00      0.00
分别统计的是12:53:06到12:53:07和12:53:07到12:53:08这两秒的IO使用情况。
各列的意义如下:
tps:transfer per second,每秒的transfer速率,一次物理IO请求算一次transfer,但多次逻辑IO请求可能组合起来才算一次transfer。
rd_sec/s:每秒读取的扇区数,扇区大小为512字节。
wr_sec/s:每秒写入的扇区数。
avgrq-sz:请求写入设备的平均大小,单位为扇区。(The average size (in sectors) of the requests that were issued to the device)
avgqu-sz:请求写入设备的平均队列长度。(The average queue length of the requests that were issued to the device.)
await:写入设备的IO请求的平均(消耗)时间,单位微秒(The average time for I/O requests issued to the device to be served.)
svctm:不可信的列,该列未来将被移除,所以不用管
%util:最重要的一列,显示的是设备的带宽情况。该列若接近100%,说明磁盘速率饱和了。
10.6 free命令
free用于查看内存使用情况。CentOS 6和CentOS 7上显示格式不太一样。
free [options]
选项说明:-h:人类可读方式显式单位-m:以MB为显示单位-w:将buffers和cache分开单独显示。只对CentOS 7上有效-s:动态查看内存信息时的刷新时间间隔-c:一共要刷新多少次退出free
以下以CentOS 7上的free结果说明各列的意义。
[root@server2 ~]# free -m
              total        used        free      shared  buff/cache   available
Mem:           1824         131        1286           8         407        1511Swap:          1999           0        1999
Mem和Swap分别表示物理内存和交换分区的使用情况。
total:总内存空间
used:已使用的内存空间。该值是total-free-buffers-cache的结果
free:未使用的内存空间
shared:/tmpfs总用的内存空间。对内核版本有要求,若版本不够,则显示为0。
buff/cache:buffers和cache的总占用空间
available:可用的内存空间。即程序启动时,将认为可用空间有这么多。可用的内存空间为free+buffers+cache。
所以available才是真正需要关注的可使用内存空间量。
使用-w可以将buffers/cache分开显示。
[root@server2 ~]# free -w -m
              total        used        free      shared     buffers       cache   available
Mem:           1824         131        1286           8           0         406        1511Swap:          1999           0        1999
还可以动态统计内存信息,例如每秒统计一次,统计2次。
[root@server2 ~]# free -w -m -s 1 -c 2  total        used        free      shared     buffers       cache   available
Mem:           1824         130        1287           8           0         406        1512Swap:          1999           0        1999  total        used        free      shared     buffers       cache   available
Mem:           1824         130        1287           8           0         406        1512Swap:          1999           0        1999
以下是CentOS 6上的free结果。
[root@xuexi ~]# free -m
             total       used       free     shared    buffers     cached
Mem:           980        415        565          0         53        239-/+ buffers/cache:        121        859Swap:         1999          0       1999
在此结果中,"-/+ buffers/cache"的free列才是真正可用的内存空间了,即CentOS 7上的available列。
一般来说,内存可用量的范围低于20%应该要引起注意了。
回到系列文章大纲:
转载请注明出处:
Ce qui précède est le contenu détaillé de. pour plus d'informations, suivez d'autres articles connexes sur le site Web de PHP en chinois!
Articles Liés
Voir plus- Apprenez à installer le serveur Nginx sous Linux
- Introduction détaillée à la commande wget de Linux
- Explication détaillée d'exemples d'utilisation de yum pour installer Nginx sous Linux
- Explication détaillée des problèmes de connexions des travailleurs dans Nginx
- Explication détaillée du processus d'installation de python3 sous Linux