Maison >développement back-end >Tutoriel Python >tutoriel python sur l'utilisation de matplotlib pour dessiner des histogrammes
tutoriel python sur l'utilisation de matplotlib pour dessiner des histogrammes
- 高洛峰original
- 2017-02-10 09:34:128927parcourir
Le concept de Matplotlib ne sera pas présenté ici
L'éditeur a également partagé avec vous les effets de graphique linéaire et de diagramme circulaire obtenus par python à l'aide de matplotlib auparavant. Les amis intéressés peuvent également cliquer pour voir, ci-dessous Prenons. un aperçu de la façon dont Python utilise matplotlib pour dessiner un histogramme, comme suit :
1. Histogramme de base
import matplotlib.pyplot as plt

data = [5, 20, 15, 25, 10]

plt.bar(range(len(data)), data)
plt.show()
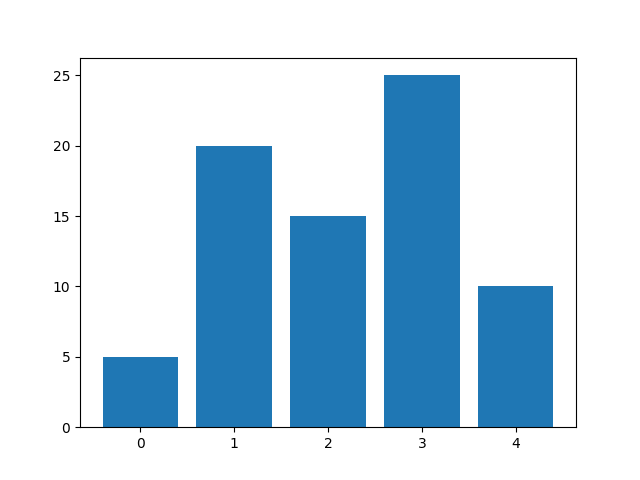
La signature de la fonction plt.bar est :
bar(left, height, width=0.8, bottom=None, **kwargs)
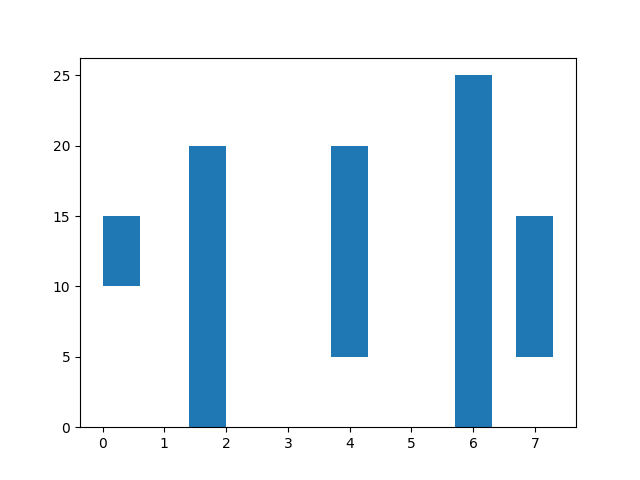
En fait, à gauche, Les quatre les paramètres de hauteur, de largeur et de fond déterminent la position et la taille du cylindre. Par défaut, left est la position centrale du cylindre (la signification de la valeur de gauche peut être modifiée via le paramètre align), c'est-à-dire :
(left - width / 2, bottom)est le coin inférieur gauche la position(left width / 2, bottom height)est la position du coin supérieur droit
Par exemple :
import matplotlib.pyplot as plt

data = [5, 20, 15, 25, 10]

plt.bar([0.3, 1.7, 4, 6, 7], data, width=0.6, bottom=[10, 0, 5, 0, 5])
plt.show()
2. Définir le style de colonne
(1) Couleur
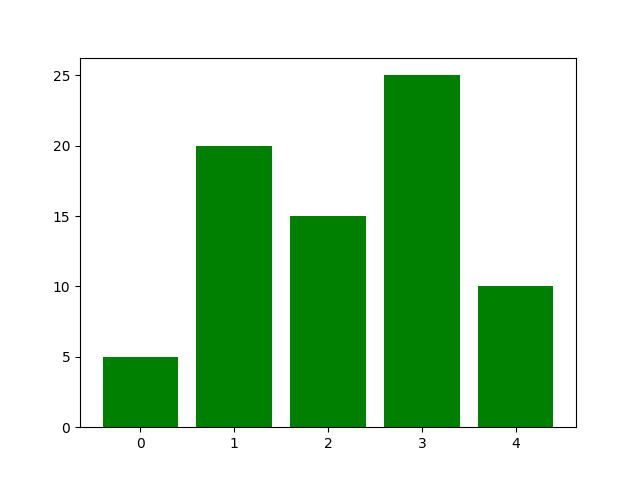
via le mot-clé facecolor (ou fc), les paramètres peuvent définir la couleur du cylindre, par exemple :
import matplotlib.pyplot as plt

data = [5, 20, 15, 25, 10]

plt.bar(range(len(data)), data, fc='g')
plt.show()
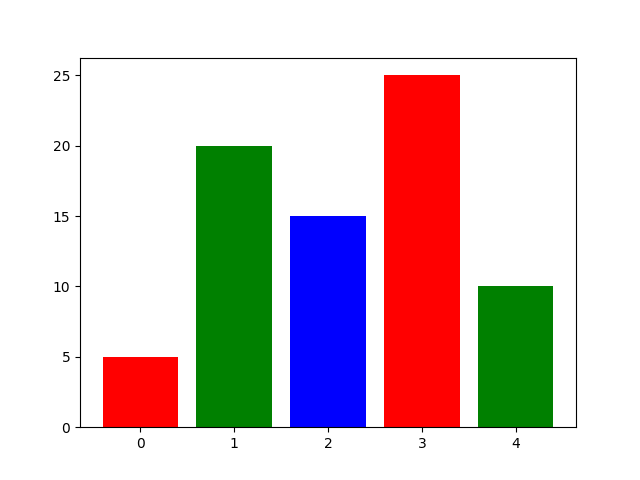
Il peut être utilisé une seule fois via le paramètre de mot-clé color. Définir plusieurs couleurs, par exemple :
import matplotlib.pyplot as plt

data = [5, 20, 15, 25, 10]

plt.bar(range(len(data)), data, color='rgb') # or `color=['r', 'g', 'b']`
plt.show()
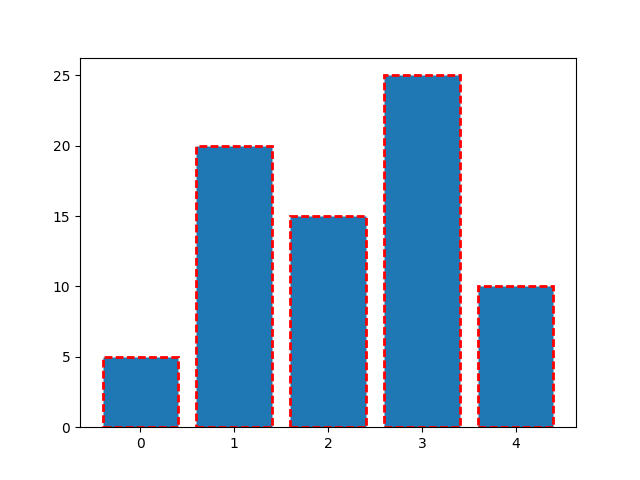
(2) Stroke
Les paramètres de mots clés pertinents sont :
edgecolor ou ec
linestyle ou ls
linewidth ou lw
Par exemple :
import matplotlib.pyplot as plt

data = [5, 20, 15, 25, 10]

plt.bar(range(len(data)), data, ec='r', ls='--', lw=2)
plt.show()
(3) Le mot-clé Fill
hatch peut être utilisé pour définir le style de remplissage, les valeurs possibles sont : /, , |, -, , x, o , Ô, ., *. Par exemple :
import matplotlib.pyplot as plt

data = [5, 20, 15, 25, 10]

plt.bar(range(len(data)), data, ec='k', lw=1, hatch='o')
plt.show()
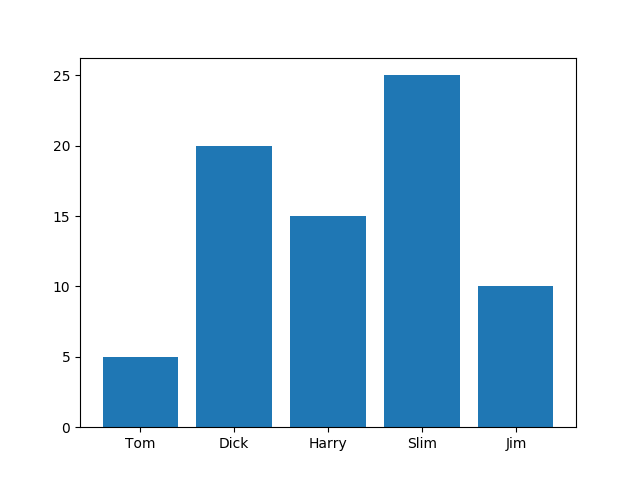
3. Définir l'étiquette de coche
import matplotlib.pyplot as plt

data = [5, 20, 15, 25, 10]
labels = ['Tom', 'Dick', 'Harry', 'Slim', 'Jim']

plt.bar(range(len(data)), data, tick_label=labels)
plt.show()
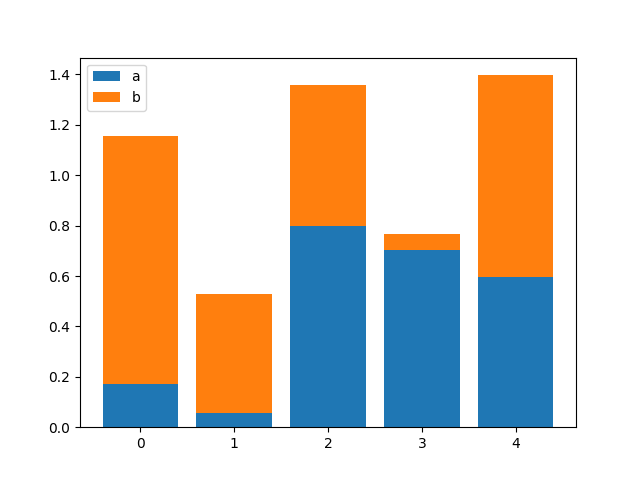
4. Passé le paramètre inférieur, vous pouvez dessiner un histogramme empilé. Par exemple :
import numpy as np
import matplotlib.pyplot as plt

size = 5
x = np.arange(size)
a = np.random.random(size)
b = np.random.random(size)

plt.bar(x, a, label='a')
plt.bar(x, b, bottom=a, label='b')
plt.legend()
plt.show()
5. >
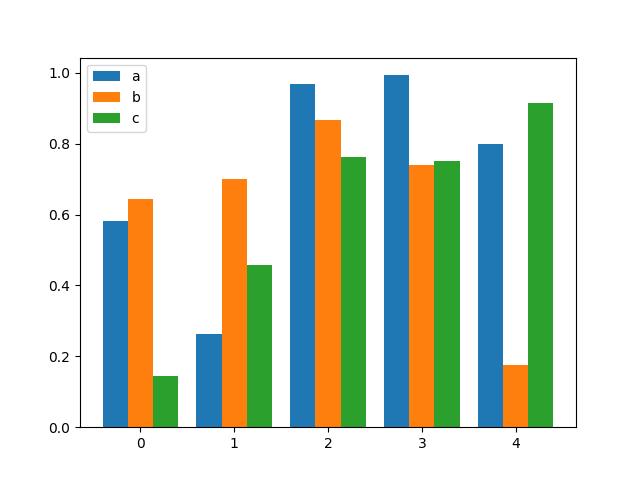
Dessiner des histogrammes côte à côte est similaire aux histogrammes empilés. Ils dessinent plusieurs groupes de colonnes. Il vous suffit de contrôler la position et la taille de chaque groupe de colonnes. Par exemple :
import numpy as np
import matplotlib.pyplot as plt

size = 5
x = np.arange(size)
a = np.random.random(size)
b = np.random.random(size)
c = np.random.random(size)

total_width, n = 0.8, 3
width = total_width / n
x = x - (total_width - width) / 2

plt.bar(x, a, width=width, label='a')
plt.bar(x + width, b, width=width, label='b')
plt.bar(x + 2 * width, c, width=width, label='c')
plt.legend()
plt.show()
 6. Graphique à barres
Utilisez la méthode barh pour dessiner un graphique à barres. Par exemple :
import matplotlib.pyplot as plt

data = [5, 20, 15, 25, 10]

plt.barh(range(len(data)), data)
plt.show()
La signature de la méthode plt.barh est : 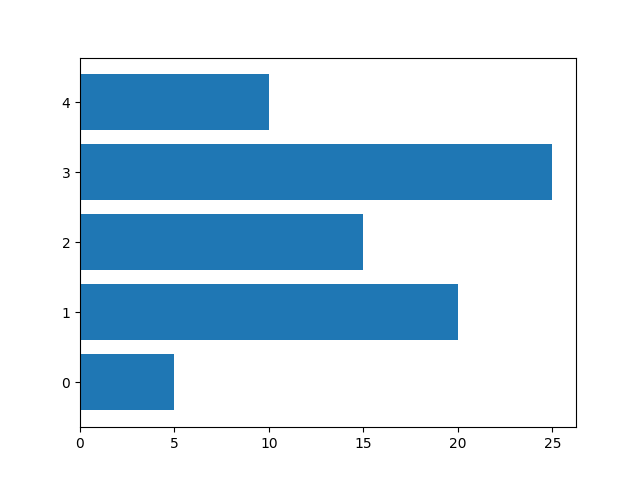
barh(bottom, width, height=0.8, left=None, **kwargs)7. Graphique à barres positives et négatives
Pour plus de tutoriels Python sur l'utilisation de matplotlib pour dessiner des histogrammes, veuillez faire attention au site Web PHP chinois !


