Maison >développement back-end >Tutoriel Python >Essayez l'analyse de données en langage naturel avec Streamlit dans Snowflake (SiS)
Essayez l'analyse de données en langage naturel avec Streamlit dans Snowflake (SiS)
- DDDoriginal
- 2024-09-14 12:15:30771parcourir
Introduction
Snowflake a publié une fonctionnalité d'assistant LLM appelée Snowflake Copilot en tant que fonctionnalité de prévisualisation. Avec Snowflake Copilot, vous pouvez analyser les données des tableaux en langage naturel.
D'autre part, Streamlit in Snowflake (SiS) vous permet d'intégrer facilement l'IA générative et d'accéder en toute sécurité aux données des tables. Cela m’a fait réfléchir : pourrions-nous créer un outil d’analyse de données en langage naturel plus proactif ? J'ai donc développé une application capable d'analyser et de visualiser des données en utilisant le langage naturel.
Remarque : cet article représente mes opinions personnelles et non celles de Snowflake.
Présentation des fonctionnalités
Objectifs
- Utilisable par les utilisateurs professionnels peu familiers avec SQL
- Possibilité de sélectionner une base de données/schéma/table via des opérations de souris pour l'analyse
- Capable d'analyser des requêtes en langage naturel très ambiguës
Captures d'écran réelles (extraits)
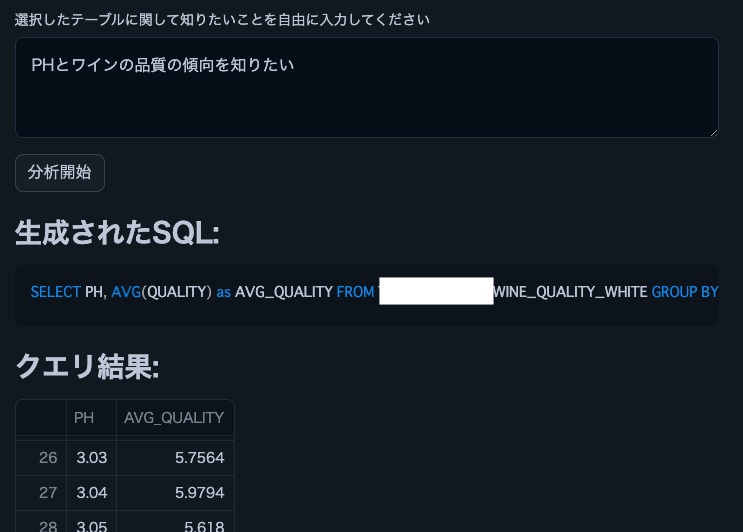
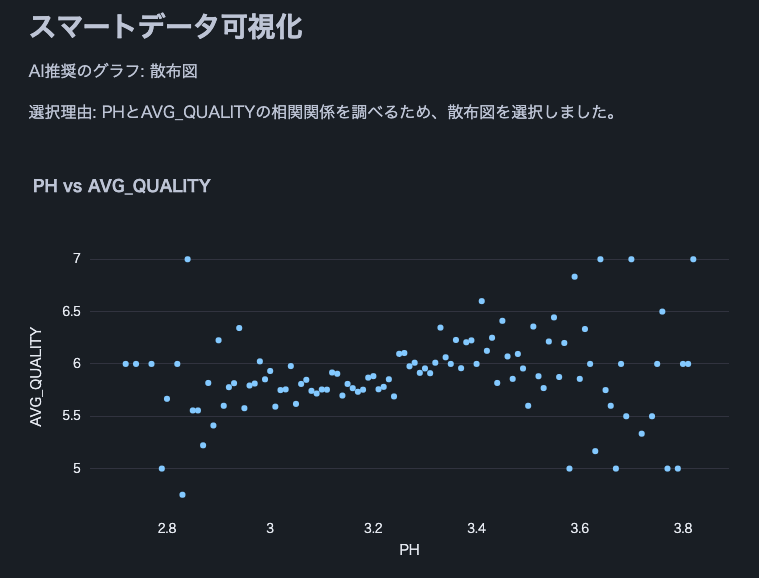
Ce qui suit sont des extraits des résultats d'analyse utilisant Cortex LLM (snowflake-arctic).


Remarque : Nous avons utilisé cet ensemble de données sur la qualité du vin.
Liste des fonctionnalités
- Sélectionnez Cortex LLM pour l'analyse
- Choisissez DB/schéma/table pour analyse
- Afficher les informations sur la colonne et les exemples de données de la table sélectionnée
- Analyse utilisant la saisie en langage naturel des utilisateurs
- Génération SQL automatique pour analyse
- Exécution automatique du SQL généré
- Affichage des résultats d'exécution des requêtes SQL
- Informations sur les données fournies par Cortex LLM
- Visualisation des données
- Sélection et affichage de graphiques appropriés par Cortex LLM
- Interprétation finale des données par Cortex LLM
Conditions de fonctionnement
- Compte Snowflake avec accès à Cortex LLM
- snowflake-ml-python 1.1.2 ou version ultérieure
Précautions
- Soyez prudent lorsque vous utilisez de grands ensembles de données, car aucune limite de données n'est définie.
- Le traitement des grands ensembles de résultats issus des requêtes SQL générées peut prendre du temps
- Des ensembles de résultats volumineux peuvent provoquer des erreurs de limite de jetons LLM
Code source
from snowflake.snowpark.context import get_active_session
import streamlit as st
from snowflake.cortex import Complete as CompleteText
import snowflake.snowpark.functions as F
import pandas as pd
import numpy as np
import json
import plotly.express as px

# Get current session
session = get_active_session()

# Application title
st.title("Natural Language Data Analysis App")

# Cortex LLM settings
st.sidebar.title("Cortex LLM Settings")
lang_model = st.sidebar.radio("Select the language model you want to use",
                              ("snowflake-arctic", "reka-flash", "reka-core",
                               "mistral-large2", "mistral-large", "mixtral-8x7b", "mistral-7b",
                               "llama3.1-405b", "llama3.1-70b", "llama3.1-8b",
                               "llama3-70b", "llama3-8b", "llama2-70b-chat",
                               "jamba-instruct", "gemma-7b")
)

# Function to escape column names
def escape_column_name(name):
    return f'"{name}"'

# Function to get table information
def get_table_info(database, schema, table):
    # Get column information
    columns = session.sql(f"DESCRIBE TABLE {database}.{schema}.{table}").collect()

    # Create DataFrame
    column_df = pd.DataFrame(columns)

    # Get row count
    row_count = session.sql(f"SELECT COUNT(*) as count FROM {database}.{schema}.{table}").collect()[0]['COUNT']

    # Get sample data
    sample_data = session.sql(f"SELECT * FROM {database}.{schema}.{table} LIMIT 5").collect()
    sample_df = pd.DataFrame(sample_data)

    return column_df, row_count, sample_df

# Data analysis function
def analyze(df, query):
    st.subheader("Result Analysis")

    # Display basic statistical information
    st.subheader("Basic Statistics")
    st.write(df.describe())

    # Use AI for data analysis
    analysis_prompt = f"""
    Based on the following dataframe and original question, please perform data analysis.
    Concisely explain in English the insights, trends, and anomalies derived from the data.
    If possible, please also mention the following points:
    1. Data distribution and characteristics
    2. Presence of abnormal values or outliers
    3. Correlations between columns (if there are multiple numeric columns)
    4. Time-series trends (if there is date or time data)
    5. Category-specific features (if data can be divided by categories)

    Dataframe:
    {df.to_string()}

    Original question:
    {query}
    """

    analysis = CompleteText(lang_model, analysis_prompt)
    st.write(analysis)

# Data visualization function
def smart_data_visualization(df):
    st.subheader("Smart Data Visualization")

    if df.empty:
        st.warning("The dataframe is empty. There is no data to visualize.")
        return

    # Request AI for graph suggestion
    columns_info = "\n".join([f"{col} - type: {df[col].dtype}" for col in df.columns])
    sample_data = df.head().to_string()

    visualization_prompt = f"""
    Analyze the information of the following dataframe and suggest the most appropriate graph type and the columns to use for its x-axis and y-axis.
    Consider the characteristics of the data to ensure a meaningful visualization.

    Column information:
    {columns_info}

    Sample data:
    {sample_data}

    Please provide only the following JSON data format as your response:
    {{
        "graph_type": "One of: scatter plot, bar chart, line chart, histogram, box plot",
        "x_axis": "Column name to use for x-axis",
        "y_axis": "Column name to use for y-axis (if applicable)",
        "explanation": "Brief explanation of the selection reason"
    }}
    """

    ai_suggestion = CompleteText(lang_model, visualization_prompt)

    try:
        suggestion = json.loads(ai_suggestion)
        graph_type = suggestion['graph_type']
        x_axis = suggestion['x_axis']
        y_axis = suggestion.get('y_axis')  # y-axis might not be needed in some cases
        explanation = suggestion['explanation']

        st.write(f"AI recommended graph: {graph_type}")
        st.write(f"Selection reason: {explanation}")

        if graph_type == "scatter plot":
            fig = px.scatter(df, x=x_axis, y=y_axis, title=f"{x_axis} vs {y_axis}")
        elif graph_type == "bar chart":
            fig = px.bar(df, x=x_axis, y=y_axis, title=f"{y_axis} by {x_axis}")
        elif graph_type == "line chart":
            fig = px.line(df, x=x_axis, y=y_axis, title=f"{y_axis} over {x_axis}")
        elif graph_type == "histogram":
            fig = px.histogram(df, x=x_axis, title=f"Distribution of {x_axis}")
        elif graph_type == "box plot":
            fig = px.box(df, x=x_axis, y=y_axis, title=f"Distribution of {y_axis} by {x_axis}")
        else:
            st.warning(f"Unsupported graph type: {graph_type}")
            return

        st.plotly_chart(fig)

    except json.JSONDecodeError:
        st.error("Failed to parse AI suggestion. Please try again.")
    except KeyError as e:
        st.error(f"AI suggestion is missing necessary information: {str(e)}")
    except Exception as e:
        st.error(f"An error occurred while creating the graph: {str(e)}")

    # AI interpretation of visualization
    visualization_interpretation_prompt = f"""
    Based on the following dataset and created graph, please provide a detailed interpretation of the data trends and characteristics in English.
    Point out possible insights, patterns, anomalies, or areas that require additional analysis.

    Dataset information:
    Columns: {', '.join(df.columns)}
    Number of rows: {len(df)}

    Created graph:
    Type: {graph_type}
    X-axis: {x_axis}
    Y-axis: {y_axis if y_axis else 'None'}
    """

    ai_interpretation = CompleteText(lang_model, visualization_interpretation_prompt)
    st.subheader("AI Interpretation of the Graph")
    st.write(ai_interpretation)

# Function to handle cases where AI response is not just SQL query
def clean_sql_query(query):
    # Remove leading and trailing whitespace
    query = query.strip()
    # If not starting with SQL keywords, remove everything up to the first SELECT
    if not query.upper().startswith(('SELECT')):
        keywords = ['SELECT']
        for keyword in keywords:
            if keyword in query.upper():
                query = query[query.upper().index(keyword):]
                break
    return query

# Function for natural language querying of DB
def data_analysis_and_natural_language_query():
    # Database selection
    databases = session.sql("SHOW DATABASES").collect()
    database_names = [row['name'] for row in databases]
    selected_database = st.selectbox("Select a database", database_names)

    if selected_database:
        # Schema selection
        schemas = session.sql(f"SHOW SCHEMAS IN DATABASE {selected_database}").collect()
        schema_names = [row['name'] for row in schemas]
        selected_schema = st.selectbox("Select a schema", schema_names)

        if selected_schema:
            # Table selection
            tables = session.sql(f"SHOW TABLES IN {selected_database}.{selected_schema}").collect()
            table_names = [row['name'] for row in tables]
            selected_table = st.selectbox("Select a table", table_names)

            if selected_table:
                # Get table information
                column_df, row_count, sample_df = get_table_info(selected_database, selected_schema, selected_table)

                st.subheader("Table Information")
                st.write(f"Table name: `{selected_database}.{selected_schema}.{selected_table}`")
                st.write(f"Total rows: **{row_count:,}**")

                st.subheader("Column Information")
                st.dataframe(column_df)

                st.subheader("Sample Data (showing only 5 rows)")
                st.dataframe(sample_df)

                # Stringify table information (for AI)
                table_info = f"""
                Table name: {selected_database}.{selected_schema}.{selected_table}
                Total rows: {row_count}

                Column information:
                {column_df.to_string(index=False)}
                Sample data:
                {sample_df.to_string(index=False)}
                """

                # Natural language input from user
                user_query = st.text_area("Enter what you want to know about the selected table")

                if st.button("Start Analysis"):
                    if user_query:
                        # Use AI to generate SQL
                        prompt = f"""
                        Based on the following table information and question, please generate an appropriate SQL query.
                        Return only the generated SQL query without any additional response.

                        Table information:
                        {table_info}

                        Question: {user_query}

                        Notes:
                        - Follow Snowflake SQL syntax.
                        - Use aggregate functions to keep the query result size manageable.
                        - Use {selected_database}.{selected_schema}.{selected_table} as the table name.
                        """

                        generated_sql = CompleteText(lang_model, prompt)
                        generated_sql = clean_sql_query(generated_sql)
                        st.subheader("Generated SQL:")
                        st.code(generated_sql, language='sql')

                        try:
                            # Execute the generated SQL
                            result = session.sql(generated_sql).collect()
                            df = pd.DataFrame(result)

                            st.subheader("Query Result:")
                            st.dataframe(df)

                            # Analyze results
                            analyze(df, user_query)

                            # Smart data visualization
                            smart_data_visualization(df)

                        except Exception as e:
                            st.error(f"An error occurred while executing the query: {str(e)}")
                    else:
                        st.warning("Please enter a question.")

# Execution part
data_analysis_and_natural_language_query()
Conclusion
La possibilité d'analyser facilement les données des tables en langage naturel sans connaissances en SQL ou Python pourrait élargir considérablement la portée de l'utilisation des données dans les entreprises pour les utilisateurs professionnels. En ajoutant des fonctionnalités telles que la jonction de plusieurs tableaux ou l'augmentation de la variété des graphiques de visualisation, des analyses encore plus complexes peuvent être effectuées. J'encourage tout le monde à essayer de mettre en œuvre la démocratisation de l'analyse des données à l'aide de Streamlit dans Snowflake.
Annonces
Snowflake Quoi de neuf Mises à jour sur X
Je partage les nouveautés de Snowflake sur X. N'hésitez pas à suivre si vous êtes intéressé !
Version anglaise
Snowflake Quoi de neuf Bot (version anglaise)
https://x.com/snow_new_en
Version japonaise
Snowflake Quoi de neuf Bot (version japonaise)
https://x.com/snow_new_jp
Historique des modifications
(20240914) Message initial
Article japonais original
https://zenn.dev/tsubasa_tech/articles/2608c820294860
Ce qui précède est le contenu détaillé de. pour plus d'informations, suivez d'autres articles connexes sur le site Web de PHP en chinois!

