
 Web Front-endJS TutorialDetailed introduction to the console.profile() function in JavaScript_javascript skills
Detailed introduction to the console.profile() function in JavaScript_javascript skills

When writing a JavaScript program, if you need to know the execution time of a certain piece of code, you can use console.time(). However, when analyzing JavaScript programs with more complex logic and trying to find performance bottlenecks, console.time() is not applicable - in-depth analysis of the operation of JavaScript programs with more complex logic means inserting a large number of console.time( ) statement, which is undoubtedly unacceptable. For JavaScript program tuning with complex logic, the correct method is to use console.profile().
Browser support
Firefox, Google Chrome and Safari with the Firebug plug-in installed all support the console.profile() statement. The latest versions of IE and Opera also provide the Profile function. The usage of console.profile() is similar in several major browsers. This article only introduces the usage of console.profile() in Firebug. One thing worth noting is that if you use the Firebug console to write JavaScript experiment code directly, console.profile() is invalid.
Usage of console.profile()
The use of console.profile() is very simple: insert console.profile() where you need to start the profile, and insert console.profileEnd() where you want to end the profile. Take the following code as an example:
function doTask(){
doSubTaskA(1000);
doSubTaskA(100000);
doSubTaskB(10000);
doSubTaskC(1000,10000);
}
function doSubTaskA(count){
for(var i=0;i
function doSubTaskB(count){
for(var i=0;i
function doSubTaskC(countX,countY){
for(var i=0;i
}
console.profile();
doTask();
console.profileEnd();
Execute console.profile() before running the doTask() function, and execute console.profileEnd() after the doTask() function is completed. In this way, detailed information during the operation of the doTask() function can be collected. You can see this in Firebug’s console:
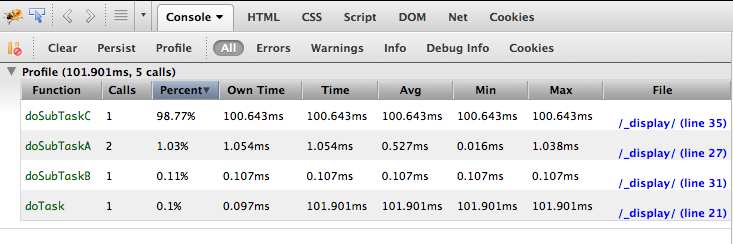
As you can see from the results: this profile time totaled 101.901ms, involving 5 function calls. The default title of the results is "Profile", which can be customized by passing parameters to the console.profile() function. For example, using console.profile("Test Profile") can change the title of the profile to "Test Profile" in the results, which is especially useful when multiple profile processes are executed at the same time. The meaning of each column in the specific profile results is:
1.Function. function name.
2. Calls. Number of calls. For example, in the above example, the doSubTaskA() function is executed twice.
3.Percent. The percentage of total time spent on this function call.
4.Own Time. Excluding the time spent calling other functions, the amount of time spent by the function itself. For example, in the above example, doTask() undoubtedly takes a long time to execute, but because all its time is spent on calling other functions, the time itself is not much, only 0.097ms.
5.Time. Contrary to Own Time, the total time taken by a function is calculated without considering calls to other functions. In the above example, the doTask() function executed for 101.901ms. Regarding Time and Own Time, we can also draw a conclusion: if Time is larger than Own Time, then the function involves calls to other functions.
6.Avg. Calculate the average total time taken by a function, and its calculation formula is: Avg=Time/Calls. In the above example, the doSubTaskA() function is executed twice, and its total time consumption is 1.054ms, so its average total time consumption is 0.527ms.
7.Min. The minimum time required to call this function. For example, in the above example, the doSubTaskA() function was executed twice, and its minimum time-consuming, that is, the less time-consuming call took 0.016ms.
8.Max. The maximum time required to call this function. For example, in the above example, the doSubTaskA() function was executed twice, and its maximum time-consuming, that is, the more time-consuming call took 1.038ms.
9.File. The JS file where the function is located.
Using the Profile button in Firebug
In addition to inserting the console.profile() statement in the JavaScript code, Firebug also provides a Profile button to dynamically profile the JavaScript code in the page in real time. The button location is:
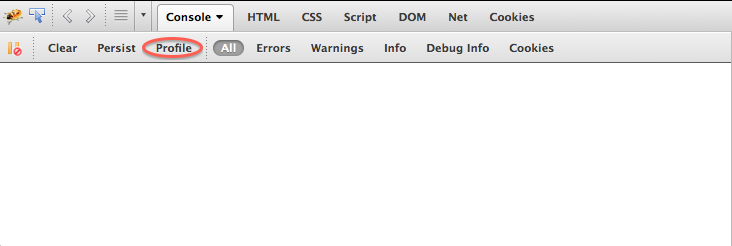
When you need to profile, you can press this button. If the subsequent page operation triggers any JavaScript code, Firebug will record this. At the end of the profiling process just press the button again. The final result is consistent with the result obtained by inserting the console.profile() statement.

 Python vs. JavaScript: A Comparative Analysis for DevelopersMay 09, 2025 am 12:22 AM
The main difference between Python and JavaScript is the type system and application scenarios. 1. Python uses dynamic types, suitable for scientific computing and data analysis. 2. JavaScript adopts weak types and is widely used in front-end and full-stack development. The two have their own advantages in asynchronous programming and performance optimization, and should be decided according to project requirements when choosing.
 Python vs. JavaScript: Choosing the Right Tool for the JobMay 08, 2025 am 12:10 AM
Whether to choose Python or JavaScript depends on the project type: 1) Choose Python for data science and automation tasks; 2) Choose JavaScript for front-end and full-stack development. Python is favored for its powerful library in data processing and automation, while JavaScript is indispensable for its advantages in web interaction and full-stack development.
 Python and JavaScript: Understanding the Strengths of EachMay 06, 2025 am 12:15 AM
Python and JavaScript each have their own advantages, and the choice depends on project needs and personal preferences. 1. Python is easy to learn, with concise syntax, suitable for data science and back-end development, but has a slow execution speed. 2. JavaScript is everywhere in front-end development and has strong asynchronous programming capabilities. Node.js makes it suitable for full-stack development, but the syntax may be complex and error-prone.
 JavaScript's Core: Is It Built on C or C ?May 05, 2025 am 12:07 AM
JavaScriptisnotbuiltonCorC ;it'saninterpretedlanguagethatrunsonenginesoftenwritteninC .1)JavaScriptwasdesignedasalightweight,interpretedlanguageforwebbrowsers.2)EnginesevolvedfromsimpleinterpreterstoJITcompilers,typicallyinC ,improvingperformance.
 JavaScript Applications: From Front-End to Back-EndMay 04, 2025 am 12:12 AM
JavaScript can be used for front-end and back-end development. The front-end enhances the user experience through DOM operations, and the back-end handles server tasks through Node.js. 1. Front-end example: Change the content of the web page text. 2. Backend example: Create a Node.js server.
 Python vs. JavaScript: Which Language Should You Learn?May 03, 2025 am 12:10 AM
Choosing Python or JavaScript should be based on career development, learning curve and ecosystem: 1) Career development: Python is suitable for data science and back-end development, while JavaScript is suitable for front-end and full-stack development. 2) Learning curve: Python syntax is concise and suitable for beginners; JavaScript syntax is flexible. 3) Ecosystem: Python has rich scientific computing libraries, and JavaScript has a powerful front-end framework.
 JavaScript Frameworks: Powering Modern Web DevelopmentMay 02, 2025 am 12:04 AM
The power of the JavaScript framework lies in simplifying development, improving user experience and application performance. When choosing a framework, consider: 1. Project size and complexity, 2. Team experience, 3. Ecosystem and community support.
 The Relationship Between JavaScript, C , and BrowsersMay 01, 2025 am 12:06 AM
Introduction I know you may find it strange, what exactly does JavaScript, C and browser have to do? They seem to be unrelated, but in fact, they play a very important role in modern web development. Today we will discuss the close connection between these three. Through this article, you will learn how JavaScript runs in the browser, the role of C in the browser engine, and how they work together to drive rendering and interaction of web pages. We all know the relationship between JavaScript and browser. JavaScript is the core language of front-end development. It runs directly in the browser, making web pages vivid and interesting. Have you ever wondered why JavaScr


Hot AI Tools

Undresser.AI Undress
AI-powered app for creating realistic nude photos

AI Clothes Remover
Online AI tool for removing clothes from photos.

Undress AI Tool
Undress images for free

Clothoff.io
AI clothes remover

Video Face Swap
Swap faces in any video effortlessly with our completely free AI face swap tool!

Hot Article
Hot Tools

SublimeText3 Mac version
God-level code editing software (SublimeText3)

Dreamweaver CS6
Visual web development tools

WebStorm Mac version
Useful JavaScript development tools

PhpStorm Mac version
The latest (2018.2.1) professional PHP integrated development tool

mPDF
mPDF is a PHP library that can generate PDF files from UTF-8 encoded HTML. The original author, Ian Back, wrote mPDF to output PDF files "on the fly" from his website and handle different languages. It is slower than original scripts like HTML2FPDF and produces larger files when using Unicode fonts, but supports CSS styles etc. and has a lot of enhancements. Supports almost all languages, including RTL (Arabic and Hebrew) and CJK (Chinese, Japanese and Korean). Supports nested block-level elements (such as P, DIV),

