

Tips for debugging JavaScript in Google Chrome_javascript tips

Google Chrome can not only be used to surf the Internet, but for developers, it is more like a powerful development aid.
If you want to do your job well, you must first sharpen your tools. Next, the author will share with you some ways to use Chrome.
If readers know how to add JavaScript breakpoints in Chrome, please continue reading; otherwise, please make up your own mind.
Suppose there is such a piece of code:
var a = 1;
function test(){
var a, b, c, d, e;
a = 2;
b = a - 1;
b = 9;
c = 3;
d = 4;
e = (a b * c) * (a - d);
return e;
}
test();
The code itself is not important, what is important is the form.
Suppose e is the result we ultimately need, but find that the result is incorrect, so we set a breakpoint on the line where e is assigned a value.
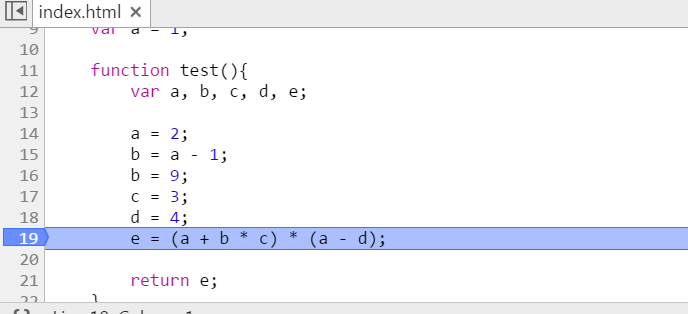
After setting the breakpoint, move the mouse to a variable and pause for a moment, Chrome will prompt you with the value of the variable at this time.
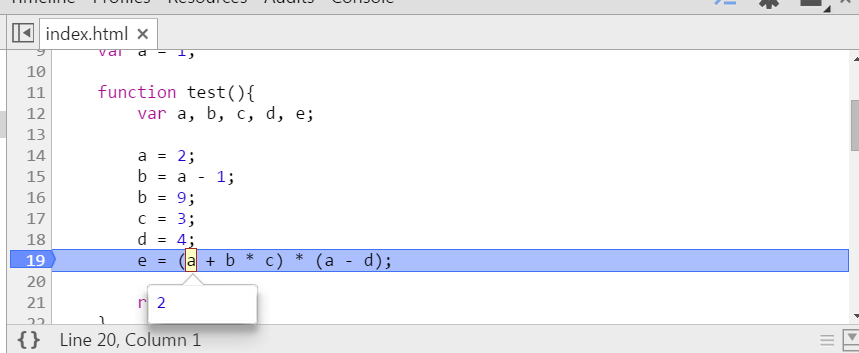
But the expression is rather complicated, and just looking at the value of a single variable has no effect. It all looks normal, but after calculation, it is wrong.
At this time, you probably want to know the result of this part (a b c). Don’t worry, select the expression first, then move the mouse to the selected area and stay for a while.
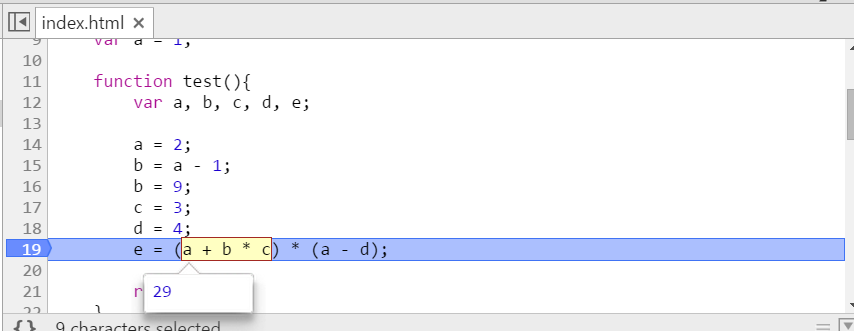
Chrome tells you the answer directly. The more interesting thing is yet to come.
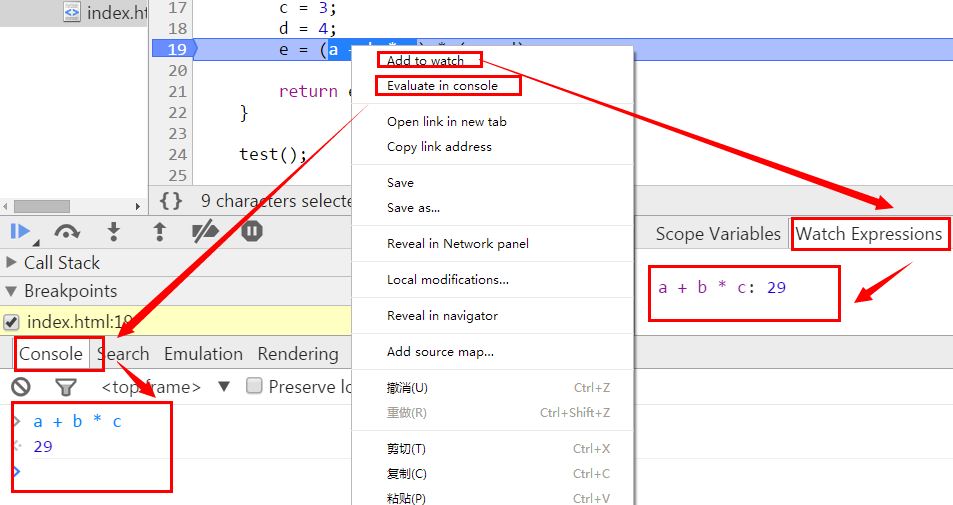
Click the right mouse button directly on the selected area, and a menu will pop up. The top two items are: [Add to watch] and [Evaluate in console]. Please refer to the picture for the specific corresponding view.
The so-called watch can be understood as monitoring. Some expressions are more important and the value of the expression may need to be monitored in real time during the entire debugging process. In this case, watch can be used.
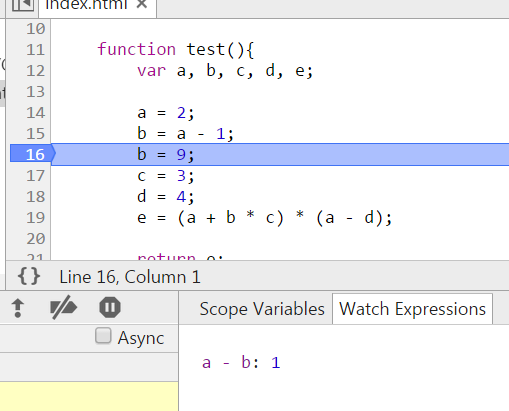
For example, we set the breakpoint at the line "b = 9;" and then add watch: "a - b" with a value of 1. As shown in the picture:
Click Next and execute "b = 9;", which means that the value of b has changed. At this time, look at the value of watch: "a - b", which is -7.
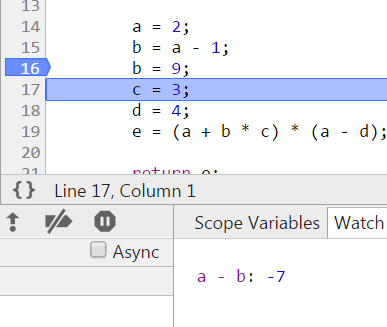
This achieves the effect of real-time monitoring, making debugging more convenient and faster.
Let’s take a look at what’s going on with the console.
Console is of course the console, and expressions can be evaluated directly in the console.
For example, if you want to know the result of (a b c), copy it directly to the console, press Enter, and the result will come out.
Wait, something seems wrong. Why does the console know the values of a, b, and c?
Executing JavaScript code in the console without breakpoints is global. In other words, a variable x is defined in the console at this time, and the scope of this x is global.
If you use the console while the program is interrupted, the console's scope faces the scope where it was interrupted. In other words, where the breakpoint is set (or where the code is executed), the scope of the console is there.
In this example, a variable a is defined in the global scope with a value of 1; at the same time, a local variable a is defined in the function test scope with a value of 2. Set a breakpoint at "a = 2;", enter a in the console, press Enter, and print out undefined.
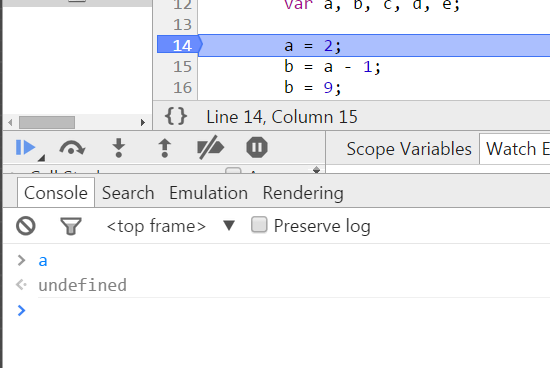
Because the program is interrupted inside the function test at this time, the program is executed in the function test, so the scope of the console is also in the function test, so the input a accesses the local variable a, but at this time the local variable a does not Assignment, so the result is undefined.
That’s all I’ll share this time. I’ll continue to share when I meet someone who is awesome. I hope it will be helpful to readers.

 Python vs. JavaScript: A Comparative Analysis for DevelopersMay 09, 2025 am 12:22 AM
The main difference between Python and JavaScript is the type system and application scenarios. 1. Python uses dynamic types, suitable for scientific computing and data analysis. 2. JavaScript adopts weak types and is widely used in front-end and full-stack development. The two have their own advantages in asynchronous programming and performance optimization, and should be decided according to project requirements when choosing.
 Python vs. JavaScript: Choosing the Right Tool for the JobMay 08, 2025 am 12:10 AM
Whether to choose Python or JavaScript depends on the project type: 1) Choose Python for data science and automation tasks; 2) Choose JavaScript for front-end and full-stack development. Python is favored for its powerful library in data processing and automation, while JavaScript is indispensable for its advantages in web interaction and full-stack development.
 Python and JavaScript: Understanding the Strengths of EachMay 06, 2025 am 12:15 AM
Python and JavaScript each have their own advantages, and the choice depends on project needs and personal preferences. 1. Python is easy to learn, with concise syntax, suitable for data science and back-end development, but has a slow execution speed. 2. JavaScript is everywhere in front-end development and has strong asynchronous programming capabilities. Node.js makes it suitable for full-stack development, but the syntax may be complex and error-prone.
 JavaScript's Core: Is It Built on C or C ?May 05, 2025 am 12:07 AM
JavaScriptisnotbuiltonCorC ;it'saninterpretedlanguagethatrunsonenginesoftenwritteninC .1)JavaScriptwasdesignedasalightweight,interpretedlanguageforwebbrowsers.2)EnginesevolvedfromsimpleinterpreterstoJITcompilers,typicallyinC ,improvingperformance.
 JavaScript Applications: From Front-End to Back-EndMay 04, 2025 am 12:12 AM
JavaScript can be used for front-end and back-end development. The front-end enhances the user experience through DOM operations, and the back-end handles server tasks through Node.js. 1. Front-end example: Change the content of the web page text. 2. Backend example: Create a Node.js server.
 Python vs. JavaScript: Which Language Should You Learn?May 03, 2025 am 12:10 AM
Choosing Python or JavaScript should be based on career development, learning curve and ecosystem: 1) Career development: Python is suitable for data science and back-end development, while JavaScript is suitable for front-end and full-stack development. 2) Learning curve: Python syntax is concise and suitable for beginners; JavaScript syntax is flexible. 3) Ecosystem: Python has rich scientific computing libraries, and JavaScript has a powerful front-end framework.
 JavaScript Frameworks: Powering Modern Web DevelopmentMay 02, 2025 am 12:04 AM
The power of the JavaScript framework lies in simplifying development, improving user experience and application performance. When choosing a framework, consider: 1. Project size and complexity, 2. Team experience, 3. Ecosystem and community support.
 The Relationship Between JavaScript, C , and BrowsersMay 01, 2025 am 12:06 AM
Introduction I know you may find it strange, what exactly does JavaScript, C and browser have to do? They seem to be unrelated, but in fact, they play a very important role in modern web development. Today we will discuss the close connection between these three. Through this article, you will learn how JavaScript runs in the browser, the role of C in the browser engine, and how they work together to drive rendering and interaction of web pages. We all know the relationship between JavaScript and browser. JavaScript is the core language of front-end development. It runs directly in the browser, making web pages vivid and interesting. Have you ever wondered why JavaScr


Hot AI Tools

Undresser.AI Undress
AI-powered app for creating realistic nude photos

AI Clothes Remover
Online AI tool for removing clothes from photos.

Undress AI Tool
Undress images for free

Clothoff.io
AI clothes remover

Video Face Swap
Swap faces in any video effortlessly with our completely free AI face swap tool!

Hot Article
Hot Tools

SublimeText3 Linux new version
SublimeText3 Linux latest version

Safe Exam Browser
Safe Exam Browser is a secure browser environment for taking online exams securely. This software turns any computer into a secure workstation. It controls access to any utility and prevents students from using unauthorized resources.

VSCode Windows 64-bit Download
A free and powerful IDE editor launched by Microsoft

PhpStorm Mac version
The latest (2018.2.1) professional PHP integrated development tool

MantisBT
Mantis is an easy-to-deploy web-based defect tracking tool designed to aid in product defect tracking. It requires PHP, MySQL and a web server. Check out our demo and hosting services.

