

 web3.010 pictures reveal the current status of the encryption market: BTC market share exceeds 52%, and stablecoin supply increased by 14% in the first quarter
Original title: The Current State of Crypto in 10 Graphs
Author: THE ALTCOIN INVESTOR
Compiled by Deep Wave TechFlow
Today I want to share 10 charts to help you navigate the current cryptocurrency market.
Ten Charts on the State of Cryptocurrency
Glassnode and Coinbase have released the Cryptocurrency Market Guide, a quarterly series designed to provide insight into Detailed analysis of the main developments in the cryptocurrency market.
Here are 10 charts from the report that caught our attention:
1. Bitcoin dominance rises from 50% to 52%

Usually an alt season triggered by a halving reduces Bitcoin’s dominance, tilting it more towards new altcoins. That hasn't happened yet, so there's plenty of room for growth.
2. Cryptocurrency Correlation

Cryptocurrency’s Historical Correlation to Traditional Asset Classes The risk is very low, suggesting that it can provide a meaningful source of idiosyncratic risk in many different portfolios.
3. Stablecoin supply rose by more than 14% in the first quarter

In evaluation An important metric to consider when considering stablecoins is the amount and nature of the reserve assets they hold. Stablecoin supply rose by more than 14% in the first quarter as market participants continued to increase their use of stablecoins.
4. Bitcoin price performance after halving

This chart measures each halving Bitcoin’s total return over the cycle. In the 12 months after the first 3 halvings, price:
Increased over 1000% after the first halving (red line)
Grown by more than 200% after the second halving (blue line)
The third halving After growing by more than 600% (green line)
5. Bitcoin available supply

The difference between the current circulating supply of a token and the illiquid supply (lost wallets, long-term holdings, locked) determines the amount of available Bitcoin supply.
After peaking in early 2020, Bitcoin’s available supply has dropped to approximately 4.6 million Bitcoins, a significant shift ahead of the fourth halving, compared to the previous The steady increase in available supply observed during the three halvings differs.
6. Bull market cycle performance

Bitcoin has historically shown exponential growth during bull markets, Prices have surged many times off the lows. The current bull cycle began in November 2022 and prices have reached 4x the lows. As the chart shows, the two previous bull markets (2015 to 2017 and 2018 to 2021) saw prices increase by 100x and 20x respectively.
7. Bitcoin’s price performance since the low

Bitcoin has completed four cycles, each cycle includes a bull market and a bear market. This chart shows how the current market cycle, starting in 2022, compares to previous cycles. In the current cycle, Bitcoin is up more than 400% in the 17 months since its lows. The current cycle is closest to the 2018 to 2022 cycle, with Bitcoin up 1000% 24 months after the low.
8. Ethereum’s price performance since the lows

Ethereum has completed two A cycle that includes bull and bear markets. This chart shows how the current market cycle, starting in 2022, compares to previous cycles. In the current cycle, Ethereum is up more than 200% in the 17 months since its lows. The current cycle is closest to the one from 2018 to 2022, with Ethereum up 400% 24 months after the lows.
9. Ethereum supply profit status

Observing supply profitability can help reveal where cryptocurrency prices are in the current market cycle, as previous cryptocurrency market cycles were characterized by three phases:
Price Bottom: In the final stages of a bear market, a prolonged price decline causes the share of loss-making supply to rise (% of profitable supply
Excitement: When parabolic price uptrends occur in bull markets, the share of profitable supply dominates (% of profitable supply > 95%).
Bull/Bear Transition: The transition period between bottom exploration and ecstasy, when supply profitability is closer to equilibrium (the percentage of profitable supply is between 55% and 95% between).
10. Ethereum weekly active addresses increased by 26%

Active addresses grew 26% in the first quarter amid price increases and Ethereum’s successful Dencun upgrade.
The above is the detailed content of 10 pictures reveal the current status of the encryption market: BTC market share exceeds 52%, and stablecoin supply increased by 14% in the first quarter. For more information, please follow other related articles on the PHP Chinese website!

 比特币创世钱包成功添加了26.9枚BTC,中本聪是否复苏?Jan 19, 2024 pm 04:27 PM
比特币之父中本聪(SatoshiNakamoto)消失多年后终于出现新线索。根据Blockchain.com链上数据,最新的数据显示,今天凌晨,有一个以bc1q9开头的地址从币安购买了27枚比特币。根据当前的比特币价格(43,506.45美元),这笔交易价值约为117.4万美元。这些比特币随后被发送到中本聪的钱包地址:"1A1zP1eP5QGefi2DMPTfTL5SLmv7DivfNa"。这一发现引起了人们对中本聪真实身份的猜测与关注。该地址是被标记为"Satoshi1",是中本聪在2009年
 哪个国家对比特币的接受度最高?Jan 19, 2024 pm 02:48 PM
比特币当前已经在全球普及,很多企业也开始接受比特币作为支付方式,但是比特币在各个国家发展并不相同,每个国家有自己的法律法规,比如中国已经明确禁止比特币挖矿,但其他国家、地区则表示对比特币的交易表示支持、欢迎,比如非洲、美国等,关于比特币最受欢迎的国家是哪个?也是一个有意思的话题,因为似乎支持比特币的国家都欢迎比特币的加入,根据Google搜索指标,非洲的尼尔利亚在比特币搜索领域名列第一,接下来小编为大家详细说说。比特币最受欢迎的国家是哪个?比特币在非洲大陆的尼日利亚是最受欢迎的国家之一。据统计,
 贝莱德向SEC确认比特币现货ETF交易代码为IBITJan 19, 2024 pm 03:30 PM
全球最大的资产管理公司BlackRock(贝莱德)最新文件显示,其正式名称代号为「IBIT」。再进一步:确认代号IBIT贝莱德的现货比特币ETF最近公开确认其交易代码为「IBIT」,在本周一提交给SEC的修订版S-1文件中披露了这一重要进展。重点解读:SEC与贝莱德协商模式中BlackRock(贝莱德)在最新文件中增加了关于基金创建和赎回机制的新设计,这一点尤其引人注目。据了解,BlackRock(贝莱德)希望采用「实物创建」(in-kind)的模式,以增加管理投资组合的灵活性。然而,SEC更倾
 什么是OCO订单?Apr 25, 2023 am 11:26 AM
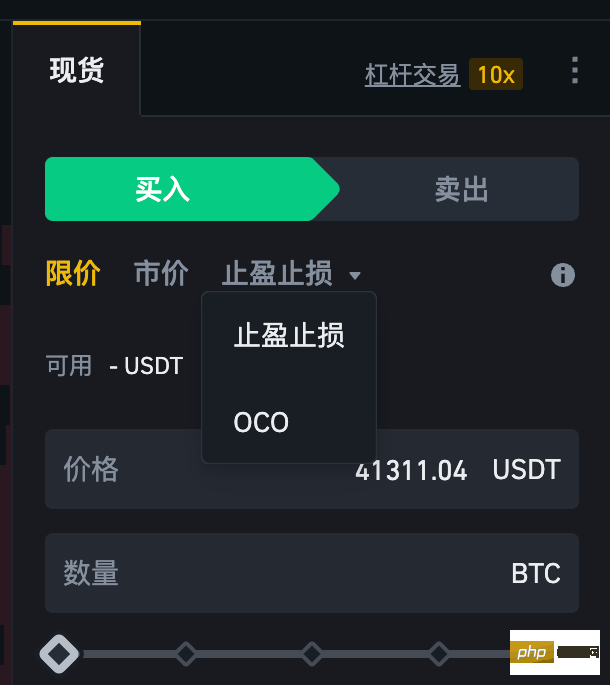
二选一订单(OneCancelstheOther,简称OCO)可让您同时下达两个订单。它结合了限价单和限价止损单,但只能执行其中一个。换句话说,只要其中的限价单被部分或全部成交、止盈止损单被触发,另一个订单将自动取消。请注意,取消其中一个订单也会同时取消另一个订单。在币安交易平台进行交易时,您可以将二选一订单作为交易自动化的基本形式。这个功能可让您选择同时下达两个限价单,从而有助于止盈和最大程度减少潜在损失。如何使用二选一订单?登录您的币安帐户之后,请前往基本交易界面,找到下图所示的交易区域。点
 Mercari:日本最大的二手电商开始接受比特币支付,活跃用户达到2200万Jan 19, 2024 pm 02:30 PM
根据日本经济新闻报道,二手交易电商平台Mercari计划从今年6月开始接受比特币支付。为了处理比特币支付,Mercari的子公司Melcoin将负责相关服务,并将所有比特币支付转换为日元。这意味着买家可以选择使用比特币进行支付,但卖家最终会收到法定货币。在Mercari平台上,商品的定价是以日元计算的,而不是以比特币计价。然而,用户在结账时可以选择使用比特币作为付款方式。日本最大二手交易电商平台Mercari成立于2013年,是日本最大的二手交易电商平台。2018年,该公司在东京证交所创业板上市
 索尼、富达、方舟等公司向美国证券交易委员会递交比特币现货ETF的证券注册申请Jan 19, 2024 pm 02:18 PM
随着市场预测美国证券交易委员会(SEC)将在1月8号至1月10号期间批准首个比特币现货ETF,现货ETF似乎已接近最后一步。越来越多的迹象和消息显示这一进展,使得投资者对比特币市场的前景更加乐观。根据最新提交给SEC的文件显示,一些著名的比特币现货ETF发行商,如富达、灰度、方舟、Valkyrie和VanEck等,都已经递交了证券注册的「8-A表格」。而Bitwise则是在上周五就率先递交了8-A表格。这些举动表明这些公司正计划发行比特币ETF,以满足市场对于加密货币的投资需求。这也意味着投资者
 数字货币交易所的合法性和安全性如何?Jan 30, 2024 pm 02:09 PM
监管政策仍在不断演变和发展中,一些国家对加密货币持开放态度,将其视为一种数字资产,允许合法交易和持有,而另一些国家则对加密货币持谨慎态度,可能限制或禁止其交易和使用,因此了解在交易所买卖数字货币合法吗?对于投资者合法合规地进行数字货币交易十分重要。在交易所买卖数字货币合法吗?在大部分国家,购买和出售数字货币是合法的,比如比特币、以太坊等。然而,不同国家和地区对数字货币的法律和监管状况存在差异,因此投资者需要根据所在地的法律了解相关规定。在一些国家,政府已经制定了特定的法规和监管机制来管理数字货币
 前SEC主席Jay Clayton:现货比特币ETF的批准势不可挡Jan 19, 2024 pm 03:45 PM
比特币现货ETF发行商在1月8日提交修订文件和公布费用结构,同时注入种子基金。SEC主席GaryGensler在此时发推呼吁加密相关风险,被视为发行前的最后提醒。SEC前主席JayClayton接受CNBC专访时也表明,批准ETF是势在必行。JayClayton:批准ETF势在必行JayClayton表示,批准比特币ETF已经是不可避免的事情,而且目前没有任何未解决的疑虑。他强调,SEC对各方提供的信息感到满意。CNBC主持人JoeKernen最近了解到投资比特币ETF所需的成本,这是需要让大家

Hot AI Tools

Undresser.AI Undress
AI-powered app for creating realistic nude photos

AI Clothes Remover
Online AI tool for removing clothes from photos.

Undress AI Tool
Undress images for free

Clothoff.io
AI clothes remover

AI Hentai Generator
Generate AI Hentai for free.

Hot Article
Hot Tools

Dreamweaver CS6
Visual web development tools

Dreamweaver Mac version
Visual web development tools

mPDF
mPDF is a PHP library that can generate PDF files from UTF-8 encoded HTML. The original author, Ian Back, wrote mPDF to output PDF files "on the fly" from his website and handle different languages. It is slower than original scripts like HTML2FPDF and produces larger files when using Unicode fonts, but supports CSS styles etc. and has a lot of enhancements. Supports almost all languages, including RTL (Arabic and Hebrew) and CJK (Chinese, Japanese and Korean). Supports nested block-level elements (such as P, DIV),

Notepad++7.3.1
Easy-to-use and free code editor

Zend Studio 13.0.1
Powerful PHP integrated development environment

