
 Software TutorialOffice SoftwareHow to make a histogram in Excel 2019_Excel 2019 histogram drawing method
Want to know how to draw a histogram in Excel 2019? PHP editor Xigua will explain in detail how to create a histogram in Excel 2019 today. This tutorial will guide you step-by-step on how to use Excel's histogram tool, allowing you to easily visualize data distribution. Read on to unlock the secret to drawing clear, easy-to-understand histograms to help you analyze and present your data efficiently!
First, we open our computer, and then we open excel2019 on our computer.

After that we create a table in the document.

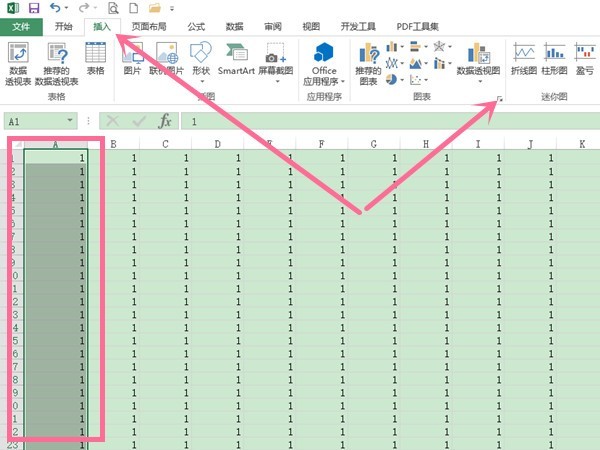
Then we select the area of the table.

After that we click Insert in the toolbar.

Then we click the drop-down arrow next to the button in the image.

In the pop-up interface, we click on the histogram.

The result is as shown in the figure, so we have made a histogram. I believe everyone can make a histogram by now.

The above is the detailed content of How to make a histogram in Excel 2019_Excel 2019 histogram drawing method. For more information, please follow other related articles on the PHP Chinese website!

 python编程用什么软件好Apr 20, 2024 pm 08:11 PM
初学者推荐 IDLE 和 Jupyter Notebook,中/高级推荐 PyCharm、Visual Studio Code 和 Sublime Text。云端 IDE Google Colab 和 Binder 提供交互式 Python 环境。其他推荐包括 Anaconda Navigator、Spyder 和 Wing IDE。选择标准包括技能水平、项目规模和个人偏好。
 python怎么用matplotlib生成图表May 05, 2024 pm 07:54 PM
要使用 Matplotlib 在 Python 中生成图表,请遵循以下步骤:安装 Matplotlib 库。导入 Matplotlib 并使用 plt.plot() 函数生成图表。自定义图表,设置标题、标签、网格、颜色和标记。使用 plt.savefig() 函数将图表保存到文件。
 access是什么软件Apr 10, 2024 am 10:55 AM
Microsoft Access 是一款关系型数据库管理系统 (RDBMS),用于存储、管理和分析数据。它主要用于数据管理、导入/导出、查询/报表生成、用户界面设计和应用程序开发。Access 优势包括易用性、集成数据库管理、强大灵活、与 Office 集成和可扩展性。
 怎么在mysql中查看关系图数据Apr 27, 2024 am 09:51 AM
MySQL 查看关系图数据的方法包括:使用 ER 图工具(如 MySQL Workbench)可视化数据库结构。使用查询提取关系图数据,如获取表、列、主键和外键。使用命令行工具(如 mysqldump 和 mysql)导出结构和数据。
 在CentOS上安装Jupyter Lab和Jupyter Notebook的详细指南Feb 10, 2024 pm 09:48 PM
JupyterLab和JupyterNotebook是两个非常流行的Python开发环境,它们提供了交互式的数据分析和编程体验,在本文中,我们将介绍如何在CentOS上安装这两个工具。安装JupyterLab1.安装Python和pip我们需要确保已经安装了Python和pip,在终端中输入以下命令来检查它们是否已经安装:```shellpython--versionpip--version```如果没有安装,可以使用以下命令来安装它们:sudoyuminstallpython3python3-
 access数据库有什么功能Apr 10, 2024 pm 12:29 PM
Microsoft Access 是一款用于创建、管理和查询数据库的关系型数据库管理系统,提供以下功能:数据存储和管理数据查询和检索表单和报表创建数据分析和可视化关系数据库管理自动化和宏多用户支持数据库安全可移植性
 使用Go语言和D3.js构建可视化数据的最佳实践Jun 18, 2023 pm 09:13 PM
在当今数字化时代,海量数据已经成为各个领域的主要组成部分。为了更好地理解和分析这些数据,可视化成为了一种非常有用的工具。Go语言是一种高效、可靠和容易学习的编程语言,而D3.js是一个强大的JavaScript库,它提供了丰富的数据可视化技术。本文将介绍如何使用Go语言和D3.js构建可视化数据的最佳实践。第一步:准备数据在开始构建数据可视化之前,首先需要准
 excel怎么制作折线图表_excel折线图表制作教程Apr 24, 2024 pm 05:34 PM
1、打开excel表格,选中数据,点击插入,再点击图表选项右侧的展开图标。2、在所有图表页面点击折线图,选择需要制作的折线图类型,点击确定即可。


Hot AI Tools

Undresser.AI Undress
AI-powered app for creating realistic nude photos

AI Clothes Remover
Online AI tool for removing clothes from photos.

Undress AI Tool
Undress images for free

Clothoff.io
AI clothes remover

AI Hentai Generator
Generate AI Hentai for free.

Hot Article
Hot Tools

Dreamweaver Mac version
Visual web development tools

Atom editor mac version download
The most popular open source editor

WebStorm Mac version
Useful JavaScript development tools

VSCode Windows 64-bit Download
A free and powerful IDE editor launched by Microsoft

Notepad++7.3.1
Easy-to-use and free code editor

