
 Software TutorialOffice SoftwareHow to make an electronic mind map in wps_How to make an electronic mind map in wps
How to make an electronic mind map in wps_How to make an electronic mind map in wps

Many people have the need to use mind maps to organize their ideas. In this article, PHP editor Yuzi introduces how to use wps to create electronic mind maps. The detailed steps are as follows. I believe it can help everyone improve the efficiency of organizing their ideas. Welcome read.
1. First open wps, click on the home page, and click on New.

2. Then click on Mind Map and click on New Blank Mind Map.

3. Then click on the structure option and select the structure distribution form you need.

4. Then edit the mind map content as required and save it in an electronic document format.

The above is the detailed content of How to make an electronic mind map in wps_How to make an electronic mind map in wps. For more information, please follow other related articles on the PHP Chinese website!

 Excel IF function with multiple conditionsMay 12, 2025 am 11:02 AM
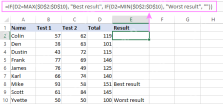
The tutorial shows how to create multiple IF statements in Excel with AND as well as OR logic. Also, you will learn how to use IF together with other Excel functions. In the first part of our Excel IF tutorial, we looked at how to constru
 How to calculate percentage in Excel - formula examplesMay 12, 2025 am 10:28 AM
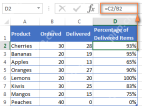
In this tutorial, you will lean a quick way to calculate percentages in Excel, find the basic percentage formula and a few more formulas for calculating percentage increase, percent of total and more. Calculating percentage is useful in m
 Logical operators in Excel: equal to, not equal to, greater than, less thanMay 12, 2025 am 09:41 AM
Logical operators in Excel: The key to efficient data analysis In Excel, many tasks involve comparing data in different cells. To this end, Microsoft Excel provides six logical operators, also known as comparison operators. This tutorial is designed to help you understand the connotation of Excel logical operators and write the most efficient formulas for data analysis. Excel logical operators equal Not equal to Greater than/less than/greater than/six equal to/less than equal to Common uses of logical operators in Excel Overview of Excel Logical Operators Logical operators in Excel are used to compare two values. Logical operators are sometimes called boolean operators because in any given case, the result of comparison
 How to show percentage in ExcelMay 12, 2025 am 09:40 AM
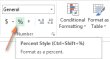
This concise guide explores Excel's percentage formatting capabilities, covering various scenarios and advanced techniques. Learn how to format existing values, handle empty cells, and customize your percentage display. To quickly apply percentage f
 Logical functions in Excel: AND, OR, XOR and NOTMay 12, 2025 am 09:39 AM
The tutorial explains the essence of Excel logical functions AND, OR, XOR and NOT and provides formula examples that demonstrate their common and inventive uses. Last week we tapped into the insight of Excel logical operators that are us
 Comments vs. Notes in Microsoft Excel: What's the Difference?May 12, 2025 am 06:03 AM
This guide explores Microsoft Excel's comment and note features, explaining their uses and differences. Both tools annotate cells, but serve distinct purposes and display differently in printed worksheets. Excel Comments: Collaborative Annotations E
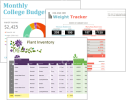 Excel templates: how to make and useMay 11, 2025 am 10:43 AM
Excel template: a tool for efficient office work Microsoft Excel templates are a powerful tool to improve the efficiency of Excel, saving significantly time. After creating a template, you only need a small amount of adjustment to adapt to different scenarios and achieve reuse. Well-designed Excel templates can also improve the aesthetics and consistency of documents, leaving a good impression on colleagues and bosses. The value of templates is particularly prominent for common document types such as calendars, budget planners, invoices, inventory tables, and dashboards. What else is more convenient than just using a spreadsheet that looks beautiful, has a full-featured and is easy to customize? A Microsoft Excel template is a pre-designed workbook or worksheet, most of which
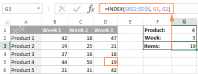 Excel INDEX function with formula examplesMay 11, 2025 am 10:42 AM
This Excel INDEX function tutorial explores its versatile applications beyond basic cell referencing. We'll delve into various formula examples showcasing INDEX's efficiency in data manipulation and analysis. INDEX, often underestimated, is a powerf


Hot AI Tools

Undresser.AI Undress
AI-powered app for creating realistic nude photos

AI Clothes Remover
Online AI tool for removing clothes from photos.

Undress AI Tool
Undress images for free

Clothoff.io
AI clothes remover

Video Face Swap
Swap faces in any video effortlessly with our completely free AI face swap tool!

Hot Article
Hot Tools

SublimeText3 English version
Recommended: Win version, supports code prompts!

Safe Exam Browser
Safe Exam Browser is a secure browser environment for taking online exams securely. This software turns any computer into a secure workstation. It controls access to any utility and prevents students from using unauthorized resources.

SecLists
SecLists is the ultimate security tester's companion. It is a collection of various types of lists that are frequently used during security assessments, all in one place. SecLists helps make security testing more efficient and productive by conveniently providing all the lists a security tester might need. List types include usernames, passwords, URLs, fuzzing payloads, sensitive data patterns, web shells, and more. The tester can simply pull this repository onto a new test machine and he will have access to every type of list he needs.

Notepad++7.3.1
Easy-to-use and free code editor

PhpStorm Mac version
The latest (2018.2.1) professional PHP integrated development tool

