Home >Software Tutorial >Computer Software >Operation process of Edraw flow chart making software design relationship matrix progress chart
Operation process of Edraw flow chart making software design relationship matrix progress chart
- 王林forward
- 2024-04-08 09:40:22823browse
php editor Yuzai will explain in detail the operation process of Edraw flow chart making software design relationship matrix progress chart. Edraw flowchart making software can help users quickly draw various flowcharts, making complex processes simple and easy to understand. When designing relationship matrices and progress charts, mastering the correct operating methods can improve work efficiency and improve chart quality. Through the introduction of this article, I believe you will be able to use Edraw software for flowchart design with greater ease.
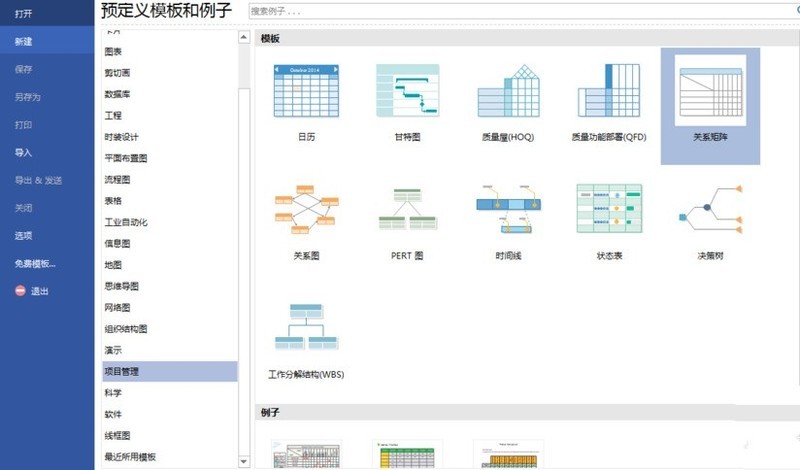
1. Open the Edraw flow chart making software and follow this operation [New --->Project Management --->Relationship Matrix], as shown in the figure:
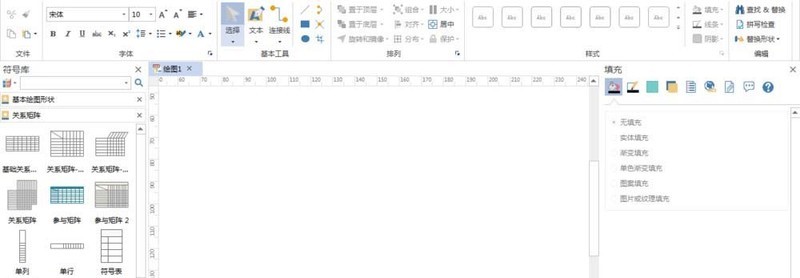
2. Click the [Create] operation to create a blank canvas and view the basic elements, as shown in the figure:
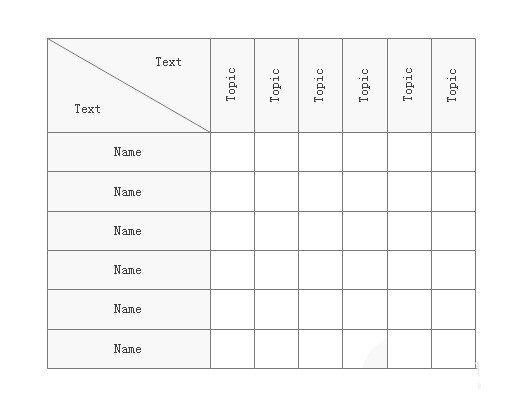
3. Find [Relationship Matrix-Vertical Title] in the [Relationship Matrix] menu bar 】, drag one onto the canvas, as shown in the picture:
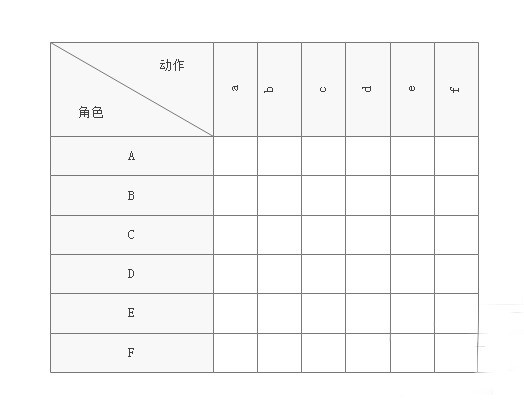
4. Modify the first row and column of the relationship matrix and set them to displayable content, as shown in the picture:
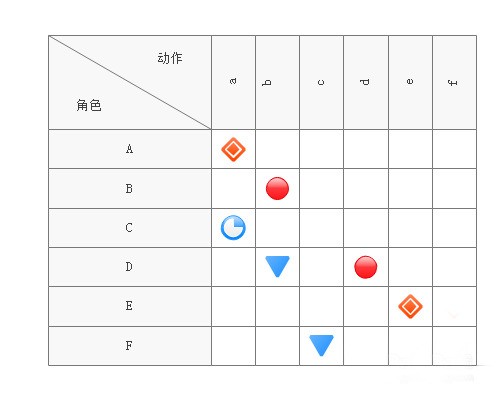
5. Corresponding to the rows and columns, add small icons in the grid. Icons can be added according to the project progress, as shown in the figure:
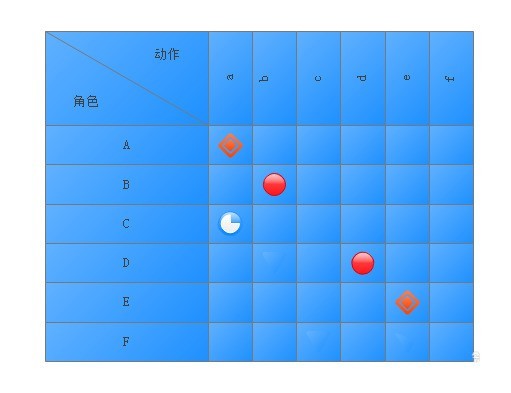
6. Select [Relationship Matrix] , set the fill color [Single Color Gradient Fill] to blue, as shown in the picture:
The above is the detailed content of Operation process of Edraw flow chart making software design relationship matrix progress chart. For more information, please follow other related articles on the PHP Chinese website!
Related articles
See more- How to upgrade Maxthon browser
- How to clear stored data in Huomiao Conference
- How to cancel table gridlines in EXCEL2021 Operation method
- How to adjust the speaking speed of computer clipped text when reading aloud. Tutorial on how to set the speed.
- How to modify the interface font size in WPS2019 to improve everyone's work efficiency

