 Software Tutorial
 Office Software
 Operation steps for drawing force graphs for physics problems using wps
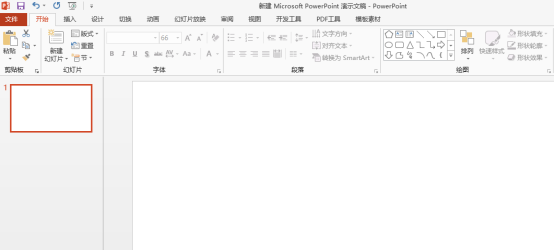
php editor Zimo will introduce you to the steps of drawing force graphics for physics problems in wps. When doing physics problems, drawing a force diagram is an essential part. In wps, through simple operations, you can easily draw a clear and intuitive force diagram to help understand the meaning of the question and the ideas for solving the problem. Next, let’s take a look at the specific steps! First, open the wps software, select the "Graphics" option in the "Insert" menu, then select the "Straight Line" tool to draw the object, select the "Arrow Line" tool above or below the object to draw the force, adjust the arrow direction and length, and finally mark The magnitude of the force can be used to draw the force diagram.
1. Open wps.
2. Click Presentation to create a new blank document (slide).

3. Enter the title, set the word color and fill shading, and create a new slide.


#4. Click Insert menu → Shape → Right Triangle and draw a triangle in the editing area.


5. Select the ellipse in the shape, draw a circle at the triangle in the editing area, and press the Ctrl key to copy a circle.


#6. Draw the optional flow chart in the flow chart, that is, the rounded rectangle, and rotate it. Change the graphics color.


The above is the detailed content of Operation steps for drawing force graphs for physics problems using wps. For more information, please follow other related articles on the PHP Chinese website!
 wps云文档空间满了怎么清除Jan 05, 2021 am 10:59 AM
清除方法:1、电脑中打开wps,登录账号;2、点击右上角的头像,打开个人中心页面;3、在注册用户板块,点击“更多云服务”的下拉箭头,点击“立即前往”;4、点击“我的文档”,选中需要删除的文件,点击最右边的三个圆点点,选择“移至回收站“即可。
 wps背景图片怎么设置Dec 30, 2020 pm 03:33 PM
wps设置背景图片的方法:1、打开WPS文字程序;2、在WPS主界面上方点击“页面布局”选项下的“背景”;3、在“背景”菜单下点击“图片”,并在对话框中选择图片;4、在电脑上根据路径选择要作为背景的图片即可。
 建筑ppt可以直接绘制平面图吗Mar 20, 2024 am 08:43 AM
ppt在很多领域和工作中被广泛使用,教育类、建筑类等等的使用更是普遍。提到建筑ppt,肯定我们首先想到的是一些建筑类图纸的呈现,如果我们没有使用专业图纸绘画软件,能不能直接绘制简单的建筑平面图呢?其实,这里,我们是可以完成操作的,下边,我们就绘制一个比较简单的平面图,给大家一个思路,希望大家能够在这个思路下完成更好的平面图绘制。1、首先,我们双击打开桌面上ppt软件,单击新建演示空白文档。2、我们在菜单栏找到插入→形状→矩形。3、绘制矩形完成,随后,双击图形,我们修改填充颜色类型,这里我们可以修
 如何使用Java在OpenCV中绘制带箭头的线条?Aug 20, 2023 pm 02:41 PM
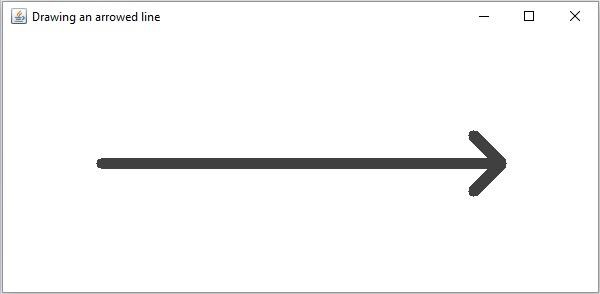
JavaOpenCV库的org.opencv.imgproc包包含一个名为Imgproc的类,该类提供了各种方法来处理输入图像。它提供了一组在图像上绘制几何形状的方法。要绘制一个带箭头的线条,您需要调用这个类的arrowedLine()方法。该方法接受以下参数:表示要在其上绘制线条的图像的Mat对象。表示线条之间的两个点的Point对象。drawn.表示线条颜色的Scalar对象。(BGR)表示线条厚度的整数(默认值:1)。示例importorg.opencv.core.Core;importo
 如何用Python绘制3D地理图表Sep 28, 2023 am 10:19 AM
如何用Python绘制3D地理图表概述:绘制3D地理图表可以帮助我们更直观地理解地理数据和空间分布。Python作为一种功能强大且易于使用的编程语言,提供了许多库和工具,可用于绘制各种类型的地理图表。在本文中,我们将学习如何使用Python编程语言和一些流行的库,如Matplotlib和Basemap,来绘制3D地理图表。环境准备:在开始之前,我们需要确保已
 如何使用Python在图片上绘制几何形状Aug 18, 2023 pm 01:02 PM
如何使用Python在图片上绘制几何形状引言:Python作为一种强大的编程语言,不仅可以进行数据处理和机器学习等高级技术,还可以进行图像处理和图形绘制。在图像处理中,经常需要在图片上绘制各种几何形状,本文将介绍如何使用Python来实现在图片上绘制几何形状的方法。一、环境准备和库安装在开始之前,我们首先需要安装Python的几个必要库,主要包括OpenCV
 五分钟学会用Python绘制树状图和雷达图Sep 27, 2023 pm 12:48 PM
五分钟学会用Python绘制树状图和雷达图在数据可视化中,树状图和雷达图是两种常用的图表形式。树状图用于展示层级结构,而雷达图则用于比较多个维度的数据。本文将介绍如何使用Python绘制这两种图表,并提供具体的代码示例。一、绘制树状图Python中有多个库可以用于绘制树状图,如matplotlib和graphviz。下面以使用matplotlib库为例,演示
 三分钟学会用Python绘制线形图、柱状图和饼图Sep 27, 2023 am 09:29 AM
三分钟学会用Python绘制线形图、柱状图和饼图Python是一种非常流行的编程语言,广泛应用于数据分析和可视化。在这篇文章中,我们将学习如何使用Python绘制三种常见的图表:线形图、柱状图和饼图。我将为你提供具体的代码示例,以帮助你快速上手。线形图线形图是一种通过连接数据点来显示趋势变化的图表类型。在Python中,我们可以使用matplotlib库来绘


Hot AI Tools

Undresser.AI Undress
AI-powered app for creating realistic nude photos

AI Clothes Remover
Online AI tool for removing clothes from photos.

Undress AI Tool
Undress images for free

Clothoff.io
AI clothes remover

AI Hentai Generator
Generate AI Hentai for free.

Hot Article

Hot Tools

Dreamweaver CS6
Visual web development tools

ZendStudio 13.5.1 Mac
Powerful PHP integrated development environment

MinGW - Minimalist GNU for Windows
This project is in the process of being migrated to osdn.net/projects/mingw, you can continue to follow us there. MinGW: A native Windows port of the GNU Compiler Collection (GCC), freely distributable import libraries and header files for building native Windows applications; includes extensions to the MSVC runtime to support C99 functionality. All MinGW software can run on 64-bit Windows platforms.

VSCode Windows 64-bit Download
A free and powerful IDE editor launched by Microsoft

Dreamweaver Mac version
Visual web development tools


