
 Software TutorialOffice SoftwareDetailed steps for making long shadow data charts from PPT documents
Detailed steps for making long shadow data charts from PPT documents

php editor Baicao will introduce you in detail the steps to create long shadow data charts from PPT documents. In PPT, long shadow data charts can increase the visibility and attractiveness of the data, making it easier for the audience to understand and remember the data information. The following will explain step by step how to create a long shadow data chart in PPT to make your presentation more vivid and interesting. First, open your PPT document and select the slide where you want to insert the long shadow data chart.
1. Open the PPT application, create a new slide, and select a blank layout. Right-click to set the background format, set to gradient fill, linear 90 degrees, two apertures, the first color is: white background 1 dark 5%, the second color is white background 1 dark 15%, the background is set.
2. Click the Insert command, find the column chart, stacked column chart, and click Insert, so that a stacked column chart will be inserted into the PPT.

3. The system automatically generates a column chart with four categories and three series. Actually we need two series to make this chart. Therefore, select Series 3, which is the gray series, and right-click to delete.

4. We use Series 1 to display the size of the data and Series 2 to make the bars. Therefore, we first need to edit the data so that the bars become the same size. . Right-click, edit the data, open an excel table, and change the value of series 2 to a unified value of 0.3, so that the long bar will be flattened.

5. Right-click to set the series format and adjust the category spacing.

6. In this step, we beautify Series 1 used to display the data size. Right-click to format the series, and under the Fill command, select Gradient Fill. Linear 90 degrees downward, 4 apertures, all in black. The first aperture has a transparency of 26% and the second aperture has a transparency of 46%. The two apertures are located close to each other because the darkest part is directly under the projection. The transparency of the third aperture is 53%, and the position can be adjusted according to your own preferences. The transparency of the last aperture is 100%, and the position can be adjusted appropriately.


#7. Delete the grid lines, legend, and abscissa axis. If you also want to change the color of the bars, you can select the bars first, then click one by one, click Format, and Fill to change the fill color.
8. Select the chart, click Design, add chart elements, lines, and add series lines. You can download some icons from the Internet, place them on the icons, and the chart is completed.

The above is the detailed content of Detailed steps for making long shadow data charts from PPT documents. For more information, please follow other related articles on the PHP Chinese website!

 How to remove blank spaces in Excel - leading, trailing, non-breakingApr 16, 2025 am 09:05 AM
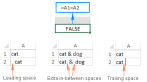
This tutorial shows you how to eliminate unwanted spaces in Excel using formulas and the handy Text Toolkit. Learn to remove leading and trailing spaces, extra spaces between words, non-breaking spaces, and other non-printing characters. The biggest
 5 Open-Source Alternatives to Microsoft ExcelApr 16, 2025 am 12:56 AM
Excel remains popular in the business world, thanks to its familiar interfaces, data tools and a wide range of feature sets. Open source alternatives such as LibreOffice Calc and Gnumeric are compatible with Excel files. OnlyOffice and Grist provide cloud-based spreadsheet editors with collaboration capabilities. Looking for open source alternatives to Microsoft Excel depends on what you want to achieve: Are you tracking your monthly grocery list, or are you looking for tools that can support your business processes? Here are some spreadsheet editors for a variety of use cases. Excel remains a giant in the business world Microsoft Ex
 Excel MATCH function with formula examplesApr 15, 2025 am 11:21 AM
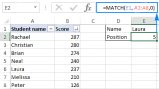
This tutorial explains how to use MATCH function in Excel with formula examples. It also shows how to improve your lookup formulas by a making dynamic formula with VLOOKUP and MATCH. In Microsoft Excel, there are many different lookup/ref
 Nested IF in Excel – formula with multiple conditionsApr 15, 2025 am 11:13 AM
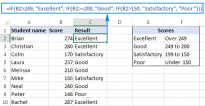
This tutorial demonstrates how to effectively use multiple IF functions in Microsoft Excel, showcasing nested IF formulas for various tasks. The core concept is using nested IF statements to evaluate multiple conditions and return different results
 Leading zeros in Excel: how to add, remove and hideApr 15, 2025 am 09:31 AM
This tutorial explores various methods for managing leading zeros in Excel, covering their preservation, display, and removal. Whether you're working with zip codes, IDs, or other data requiring leading zeros, this guide provides solutions. Excel of
 Excel HLOOKUP function with formula examplesApr 15, 2025 am 09:05 AM
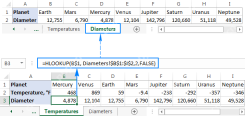
Microsoft Excel's HLOOKUP function: A comprehensive guide Excel offers three lookup functions – LOOKUP, VLOOKUP, and HLOOKUP – but HLOOKUP often causes confusion. This tutorial clarifies HLOOKUP's specifics and provides examples for efficient use. Wh
 If You Don't Rename Tables in Excel, Today's the Day to StartApr 15, 2025 am 12:58 AM
Quick link Why should tables be named in Excel How to name a table in Excel Excel table naming rules and techniques By default, tables in Excel are named Table1, Table2, Table3, and so on. However, you don't have to stick to these tags. In fact, it would be better if you don't! In this quick guide, I will explain why you should always rename tables in Excel and show you how to do this. Why should tables be named in Excel While it may take some time to develop the habit of naming tables in Excel (if you don't usually do this), the following reasons illustrate today
 Microsoft 365 Will Turn Off ActiveX, Because Hackers Keep Using ItApr 12, 2025 am 06:01 AM
Microsoft 365 is finally phasing out ActiveX, a long-standing security vulnerability in its Office suite. This follows a similar move in Office 2024. Beginning this month, Windows versions of Word, Excel, PowerPoint, and Visio in Microsoft 365 will


Hot AI Tools

Undresser.AI Undress
AI-powered app for creating realistic nude photos

AI Clothes Remover
Online AI tool for removing clothes from photos.

Undress AI Tool
Undress images for free

Clothoff.io
AI clothes remover

AI Hentai Generator
Generate AI Hentai for free.

Hot Article
Hot Tools

SublimeText3 Chinese version
Chinese version, very easy to use

ZendStudio 13.5.1 Mac
Powerful PHP integrated development environment

Zend Studio 13.0.1
Powerful PHP integrated development environment

MinGW - Minimalist GNU for Windows
This project is in the process of being migrated to osdn.net/projects/mingw, you can continue to follow us there. MinGW: A native Windows port of the GNU Compiler Collection (GCC), freely distributable import libraries and header files for building native Windows applications; includes extensions to the MSVC runtime to support C99 functionality. All MinGW software can run on 64-bit Windows platforms.

Atom editor mac version download
The most popular open source editor

