Home >Software Tutorial >Office Software >Detailed method of inserting formula effect flow chart into PPT
Detailed method of inserting formula effect flow chart into PPT
- WBOYWBOYWBOYWBOYWBOYWBOYWBOYWBOYWBOYWBOYWBOYWBOYWBforward
- 2024-03-26 16:36:18976browse
php Xiaobian Yuzai will introduce you in detail how to insert flow chart formulas into PPT. First, open the PowerPoint software and select the slide where you want to insert the formula. Next, click the "Insert" option in the menu bar, then select "Object" and select "Microsoft Equation Editor" in the pop-up window. Enter the formula you need in the formula editor and edit and format it as needed. Finally, click the "Insert" button to insert the formula into the PPT. Through the above steps, you can easily insert flow chart formulas into PPT to make your presentation more vivid and professional!
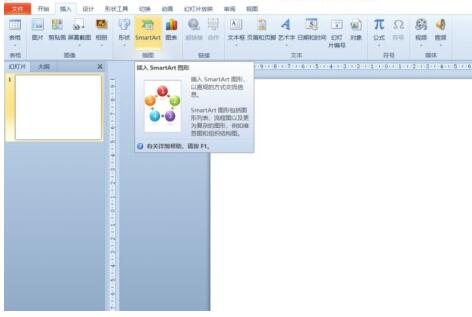
1. Open PPT, click the [Insert] tab, and click the [smartArt] button in the [Illustration] group.
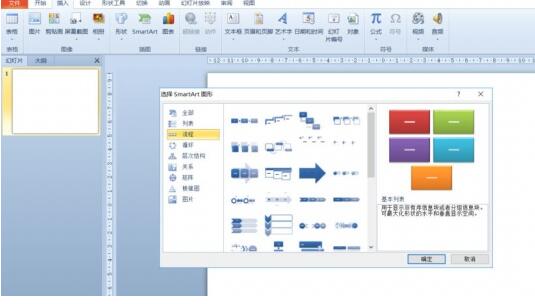
2. Click [Process] in the [Select smartArt graphics] dialog box that opens.
3. Select the [Formula] flow chart in the [Process] pane that opens.
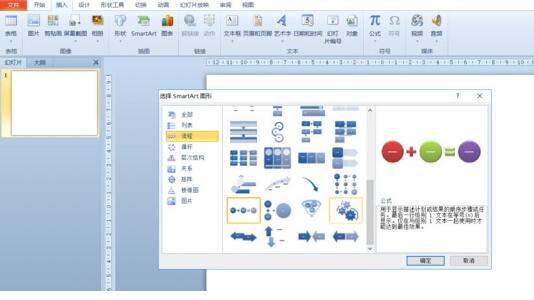
4. Click [OK], and the [Formula] flow chart will be inserted into the slide pane.
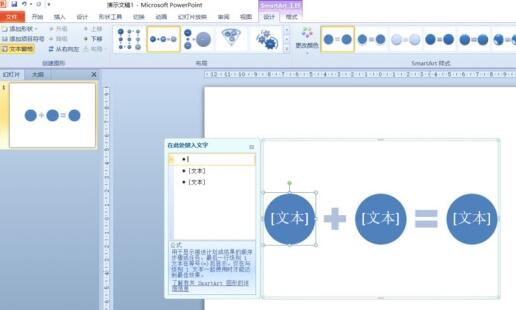
5. Click [Text] in the [Type text here] column, or click [Text] on the graphic to enter content.
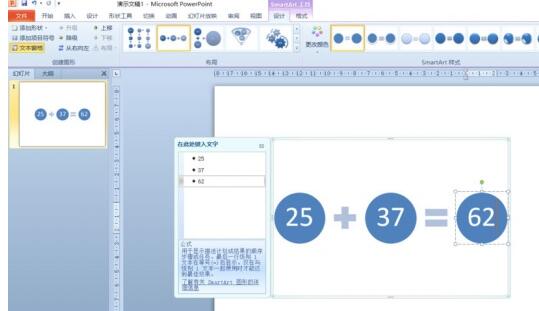
6. Select the shape in the graphic, click the [Design] tab of [smartArt Tools], and click the [Add Shape] button in the [Create Graphics] group to add a shape. .
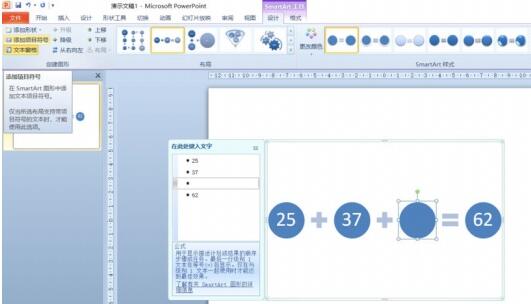
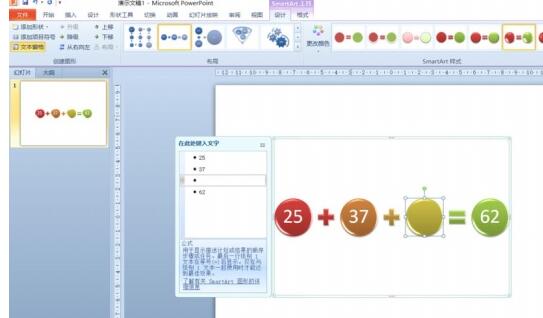
7. The shapes in the graphics can also be selected and deleted. Of course, you can also make other settings in the [Design] and [Format] of the smartart tool as needed.
The above is the detailed content of Detailed method of inserting formula effect flow chart into PPT. For more information, please follow other related articles on the PHP Chinese website!

