php editor Banana today brings you a detailed tutorial on how to draw a plate of eggs in PPT. Through this article, you will learn how to use PPT tools to draw lifelike egg patterns, which can bring you a different visual experience whether it is used for work presentations or personal study. Follow the editor to explore this interesting drawing process!
1. Open the PPT presentation as shown in the picture. Select Insert-Shape and insert a circular shape.

2. The inserted circular shape is as shown in the figure. Drag the small circle to become an ellipse, and drag the large circle to resemble an ellipse.

3. After selecting the large oval to change its style, select Start - Shape Effect - Prism, and select as shown in the figure.

4. Drag the small oval to the plate, place it on the top layer, select the small oval egg, and select Format - Shape Style. The effect is as shown in the picture.

5. Copy and paste the egg, the effect is as shown in the picture.

6. Select all shapes, right-click and select Group, as shown in the picture.

7. The final drawn eggs and plates are as shown in the picture.

The above is the detailed content of Detailed method of drawing a plate of eggs in PPT. For more information, please follow other related articles on the PHP Chinese website!
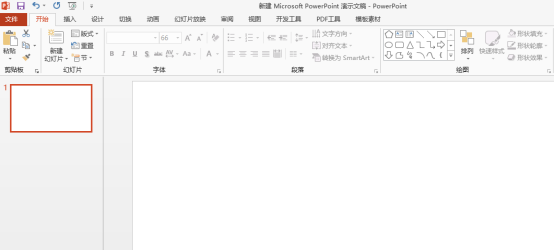 建筑ppt可以直接绘制平面图吗Mar 20, 2024 am 08:43 AM
ppt在很多领域和工作中被广泛使用,教育类、建筑类等等的使用更是普遍。提到建筑ppt,肯定我们首先想到的是一些建筑类图纸的呈现,如果我们没有使用专业图纸绘画软件,能不能直接绘制简单的建筑平面图呢?其实,这里,我们是可以完成操作的,下边,我们就绘制一个比较简单的平面图,给大家一个思路,希望大家能够在这个思路下完成更好的平面图绘制。1、首先,我们双击打开桌面上ppt软件,单击新建演示空白文档。2、我们在菜单栏找到插入→形状→矩形。3、绘制矩形完成,随后,双击图形,我们修改填充颜色类型,这里我们可以修
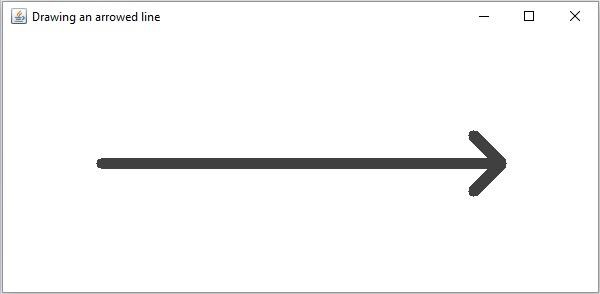 如何使用Java在OpenCV中绘制带箭头的线条?Aug 20, 2023 pm 02:41 PM
JavaOpenCV库的org.opencv.imgproc包包含一个名为Imgproc的类,该类提供了各种方法来处理输入图像。它提供了一组在图像上绘制几何形状的方法。要绘制一个带箭头的线条,您需要调用这个类的arrowedLine()方法。该方法接受以下参数:表示要在其上绘制线条的图像的Mat对象。表示线条之间的两个点的Point对象。drawn.表示线条颜色的Scalar对象。(BGR)表示线条厚度的整数(默认值:1)。示例importorg.opencv.core.Core;importo
 五分钟学会用Python绘制树状图和雷达图Sep 27, 2023 pm 12:48 PM
五分钟学会用Python绘制树状图和雷达图在数据可视化中,树状图和雷达图是两种常用的图表形式。树状图用于展示层级结构,而雷达图则用于比较多个维度的数据。本文将介绍如何使用Python绘制这两种图表,并提供具体的代码示例。一、绘制树状图Python中有多个库可以用于绘制树状图,如matplotlib和graphviz。下面以使用matplotlib库为例,演示
 如何用Python绘制3D地理图表Sep 28, 2023 am 10:19 AM
如何用Python绘制3D地理图表概述:绘制3D地理图表可以帮助我们更直观地理解地理数据和空间分布。Python作为一种功能强大且易于使用的编程语言,提供了许多库和工具,可用于绘制各种类型的地理图表。在本文中,我们将学习如何使用Python编程语言和一些流行的库,如Matplotlib和Basemap,来绘制3D地理图表。环境准备:在开始之前,我们需要确保已
 如何使用Python在图片上绘制几何形状Aug 18, 2023 pm 01:02 PM
如何使用Python在图片上绘制几何形状引言:Python作为一种强大的编程语言,不仅可以进行数据处理和机器学习等高级技术,还可以进行图像处理和图形绘制。在图像处理中,经常需要在图片上绘制各种几何形状,本文将介绍如何使用Python来实现在图片上绘制几何形状的方法。一、环境准备和库安装在开始之前,我们首先需要安装Python的几个必要库,主要包括OpenCV
 ppt如何统一调整各页图片大小Jan 07, 2021 pm 03:58 PM
ppt统一调整各页图片大小的方法:1、打开ppt软件,插入多组图片,并选中所有图片;2、在图片上右击并选择“大小和位置”;3、在弹窗中取消选择“锁定纵横比”;4、点击高度和宽度右侧的箭头,输入需要的高度和宽度即可。
 技巧大揭秘:用Python绘制漂亮的3D图表Sep 28, 2023 pm 01:01 PM
技巧大揭秘:用Python绘制漂亮的3D图表引言:在数据可视化领域,制作漂亮的3D图表能够更直观地展示数据的特征和趋势。Python作为一种功能强大的编程语言,拥有众多的库和工具,能够帮助我们实现这一目标。本文将分享一些Python绘制漂亮的3D图表的技巧和具体代码示例,帮助读者更好地理解和应用。一、准备工作:在开始之前,我们需要安装几个必要的Python库
 如何用Python绘制动画图表Sep 27, 2023 am 09:53 AM
如何用Python绘制动画图表Python作为一种功能强大的编程语言,可以用于各种数据可视化和图表绘制。其中,绘制动画图表可以让数据更加生动有趣。本文将介绍如何使用Python绘制动画图表,并提供具体的代码示例。首先,我们需要安装matplotlib库,这是Python中最常用的图表绘制库之一。在终端中运行以下命令安装matplotlib:pipinsta


Hot AI Tools

Undresser.AI Undress
AI-powered app for creating realistic nude photos

AI Clothes Remover
Online AI tool for removing clothes from photos.

Undress AI Tool
Undress images for free

Clothoff.io
AI clothes remover

AI Hentai Generator
Generate AI Hentai for free.

Hot Article

Hot Tools

Dreamweaver Mac version
Visual web development tools

VSCode Windows 64-bit Download
A free and powerful IDE editor launched by Microsoft

MinGW - Minimalist GNU for Windows
This project is in the process of being migrated to osdn.net/projects/mingw, you can continue to follow us there. MinGW: A native Windows port of the GNU Compiler Collection (GCC), freely distributable import libraries and header files for building native Windows applications; includes extensions to the MSVC runtime to support C99 functionality. All MinGW software can run on 64-bit Windows platforms.

PhpStorm Mac version
The latest (2018.2.1) professional PHP integrated development tool

SAP NetWeaver Server Adapter for Eclipse
Integrate Eclipse with SAP NetWeaver application server.


