
 Backend DevelopmentPHP TutorialAnalyzing the inner power of Xdebug: Unleashing the powerful potential of PHP debugging
Xdebug Toolbox:
- Breakpoint setting: Xdebug allows you to set breakpoints in your code and pause execution when a breakpoint is encountered, making it easy to inspect variables and inspect code flow.
- Stack trace: During debugging, Xdebug provides detailed stack traces, showing the code execution path, making it easy to identify where errors occur.
- Variable Inspection: Xdebug's interactive debugger allows you to inspect and modify the values of variables, providing insight into a real-time snapshot of your program's state.
- Performance analysis: performance. Xdebug configuration options:
Debugging engine:
Xdebug supports two debugging engines: DBGp and GDB. DBGp is suitable for most- PHP
- environments, while GDB provides more advanced functionality. IDE integration: Xdebug can be integrated with various IDEs, such as php
- StORM, Eclipse and Visual Studio Code, Provide a seamless debugging experience. Logging: Xdebug provides detailed logging
- logging capabilities that can be used to record debugging sessions and diagnose potential problems. Xdebug working principle:
Xdebug works by injecting additional code into your PHP application. When a breakpoint or debugging session is triggered, Xdebug intercepts program execution and redirects it to its debugging engine. The debugging engine provides an interactive interface where you can inspect variables, set breakpoints, and perform other debugging operations.
Debugging Best Practices:Enable Xdebug only on demand:
Xdebug may impact application performance, so enable it only during debugging.- Use breakpoints and log statements for debugging: Breakpoints and log statements are an effective way to debug your code and avoid overuse of the interactive debugger.
- Understand Xdebug configuration options: Customizing Xdebug configuration options for specific needs can optimize the debugging experience.
- Master the interactive debugger: The interactive debugger is a powerful tool of Xdebug, but it requires some practice to master it.
- Use other tools together: Xdebug is more effective when used with other debugging tools such as PHPStorm and Blackfire.
- Conclusion: Xdebug is an indispensable tool that improves PHP debugging capabilities. By understanding its internals and configuration options, you can take full advantage of its capabilities and speed up your code
and troubleshooting processes. Mastering the guts of Xdebug will enable you to gain insight into your code, solve complex problems, and write more robust and effective PHP applications.
The above is the detailed content of Analyzing the inner power of Xdebug: Unleashing the powerful potential of PHP debugging. For more information, please follow other related articles on the PHP Chinese website!

 11 Best PHP URL Shortener Scripts (Free and Premium)Mar 03, 2025 am 10:49 AM
Long URLs, often cluttered with keywords and tracking parameters, can deter visitors. A URL shortening script offers a solution, creating concise links ideal for social media and other platforms. These scripts are valuable for individual websites a
 Introduction to the Instagram APIMar 02, 2025 am 09:32 AM
Following its high-profile acquisition by Facebook in 2012, Instagram adopted two sets of APIs for third-party use. These are the Instagram Graph API and the Instagram Basic Display API.As a developer building an app that requires information from a
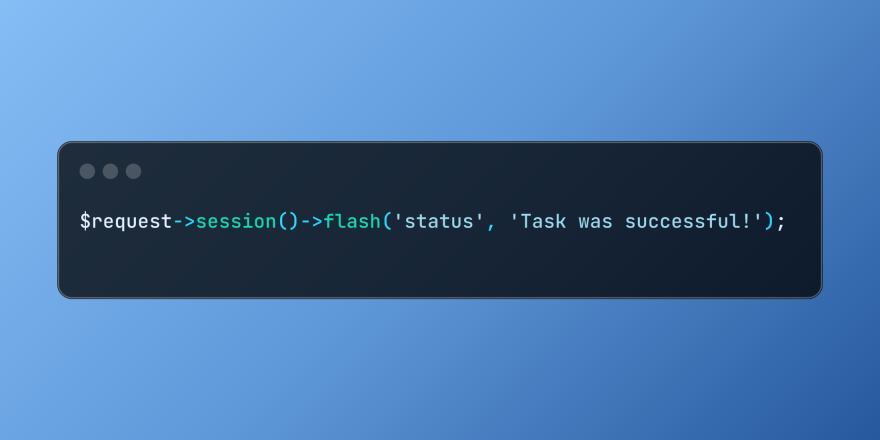 Working with Flash Session Data in LaravelMar 12, 2025 pm 05:08 PM
Laravel simplifies handling temporary session data using its intuitive flash methods. This is perfect for displaying brief messages, alerts, or notifications within your application. Data persists only for the subsequent request by default: $request-
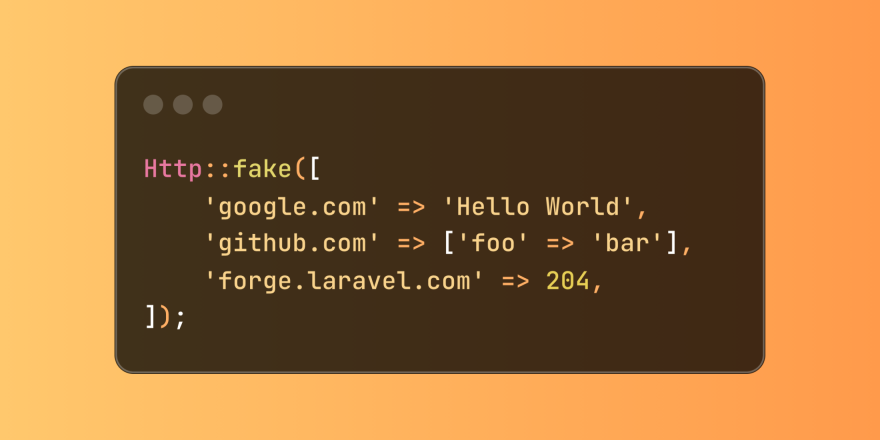 Simplified HTTP Response Mocking in Laravel TestsMar 12, 2025 pm 05:09 PM
Laravel provides concise HTTP response simulation syntax, simplifying HTTP interaction testing. This approach significantly reduces code redundancy while making your test simulation more intuitive. The basic implementation provides a variety of response type shortcuts: use Illuminate\Support\Facades\Http; Http::fake([ 'google.com' => 'Hello World', 'github.com' => ['foo' => 'bar'], 'forge.laravel.com' =>
 Build a React App With a Laravel Back End: Part 2, ReactMar 04, 2025 am 09:33 AM
This is the second and final part of the series on building a React application with a Laravel back-end. In the first part of the series, we created a RESTful API using Laravel for a basic product-listing application. In this tutorial, we will be dev
 cURL in PHP: How to Use the PHP cURL Extension in REST APIsMar 14, 2025 am 11:42 AM
The PHP Client URL (cURL) extension is a powerful tool for developers, enabling seamless interaction with remote servers and REST APIs. By leveraging libcurl, a well-respected multi-protocol file transfer library, PHP cURL facilitates efficient execution of various network protocols, including HTTP, HTTPS, and FTP. This extension offers granular control over HTTP requests, supports multiple concurrent operations, and provides built-in security features.
 12 Best PHP Chat Scripts on CodeCanyonMar 13, 2025 pm 12:08 PM
Do you want to provide real-time, instant solutions to your customers' most pressing problems? Live chat lets you have real-time conversations with customers and resolve their problems instantly. It allows you to provide faster service to your custom
 Announcement of 2025 PHP Situation SurveyMar 03, 2025 pm 04:20 PM
The 2025 PHP Landscape Survey investigates current PHP development trends. It explores framework usage, deployment methods, and challenges, aiming to provide insights for developers and businesses. The survey anticipates growth in modern PHP versio


Hot AI Tools

Undresser.AI Undress
AI-powered app for creating realistic nude photos

AI Clothes Remover
Online AI tool for removing clothes from photos.

Undress AI Tool
Undress images for free

Clothoff.io
AI clothes remover

AI Hentai Generator
Generate AI Hentai for free.

Hot Article
Hot Tools

SublimeText3 Mac version
God-level code editing software (SublimeText3)

SublimeText3 Linux new version
SublimeText3 Linux latest version

SecLists
SecLists is the ultimate security tester's companion. It is a collection of various types of lists that are frequently used during security assessments, all in one place. SecLists helps make security testing more efficient and productive by conveniently providing all the lists a security tester might need. List types include usernames, passwords, URLs, fuzzing payloads, sensitive data patterns, web shells, and more. The tester can simply pull this repository onto a new test machine and he will have access to every type of list he needs.

WebStorm Mac version
Useful JavaScript development tools

SublimeText3 English version
Recommended: Win version, supports code prompts!

