
 Backend DevelopmentPHP TutorialMaster the Xdebug secrets: making PHP debugging no longer a problem
The topic "Mastering Xdebug Cheats: Making PHP Debugging No Longer a Problem" carefully created by PHP editor Baicao aims to help PHP developers master the skills of using Xdebug debugging tools. This topic will introduce you to the functions and features of Xdebug in detail, teach you how to quickly configure and debug PHP code, and make the debugging process more efficient and easier. Follow our guide and explore the powerful features of Xdebug to make PHP debugging simple and easy!
Installation and Configuration Enabling Xdebug in PHP code requires the following steps:
- Install Xdebug extension: Use Composer or PECL to install Xdebug.
- Load extension: Load the Xdebug extension in the php.ini file.
- Configuration: Configure Xdebug settings as needed, such as breakpoint settings and trace stacks.
Using Xdebug cheats
1. Breakpoint debugging
- Set breakpoints in the source code to pause the program while the code is executing.
- Use the
xdebug_break()function to trigger a breakpoint at a specific point.
2. Stack Trace
- Use functions such as
var_dump()andprint_r()to output the value of a variable. - Enable stack tracing to see the sequence of function calls and their corresponding lines of code.
3. Variable check
- Use Xdebug's floating window or the remote debugger to view the value and type of the variable.
- Use the
xdebug_var_dump()function to obtain a detailed representation of the variable.
4. Performance analysis
- Use Xdebug's performance profiler to identify performance bottlenecks.
- View code execution time, memory usage and number of function calls.
5. Other secrets
- Use
xdebug_get_profiler_filename()Get the file name generated by the performance profiler. - Use
xdebug_dump_function_trace()Print function call tree. - Use
xdebug_start_trace()to start tracing code execution, and then usexdebug_stop_trace()to stop tracing.
Integration and Debugging Xdebug integrates with popular IDEs and debuggers to provide a seamless debugging experience:
- PhpStorm: Configure Xdebug as the debugger for PhpStorm and enjoy features such as breakpoints, stack tracing, and variable inspection.
- Visual Studio Code: Use the Xdebug plugin to enable breakpoints, view variables and analyze performance.
- Other IDEs: Xdebug is compatible with a variety of IDEs, including NetBeans, Eclipse, and Sublime Text.
common problem
1. How does Xdebug affect performance? Xdebug has a slight impact on execution time. Enabled in debug mode, should be disabled in production environment.
2. How to deal with Xdebug errors? Check that the php.ini configuration is correct and ensure that the latest version of Xdebug is installed.
3. How to optimize Xdebug performance? Adjust Xdebug settings, such as enabling stack traces only for the parts of the code that need to be debugged.
4. Does Xdebug support remote debugging? Yes, Xdebug can be configured for remote debugging via a remote debugging client.
5. How to disable Xdebug? Comment out the Xdebug extension line in the php.ini file or disable it as an IDE.
Conclusion Mastering Xdebug cheats can greatly simplify the PHP debugging process. By leveraging its powerful capabilities, developers can quickly identify errors in their code, analyze performance bottlenecks, and improve overall code quality.
The above is the detailed content of Master the Xdebug secrets: making PHP debugging no longer a problem. For more information, please follow other related articles on the PHP Chinese website!

 解释一下explorer.exe进程是什么Feb 18, 2024 pm 12:11 PM
explorer.exe是什么进程在我们使用Windows操作系统的时候,经常会听到一个名词"explorer.exe".那么,你是否好奇这个进程到底是什么?在本文中,我们将详细解释explorer.exe是什么进程以及其功能和作用。首先,explorer.exe是Windows操作系统的一个关键进程,它负责管理和控制Windows资源管理器(Window
 r5 5600x最高能带动什么显卡 最新用5600X搭配RX6800XT性能Feb 25, 2024 am 10:34 AM
10月29日,AMD终于发布了备受用户期待的重磅产品,即基于全新RDNA2架构的RX6000系列游戏显卡。这款显卡与之前推出的基于全新ZEN3架构的锐龙5000系列处理器相辅相成,形成了一个全新的双A组合。这一次的发布不仅使得竞争对手“双英”黯然失色,也对整个DIY硬件圈产生了重大影响。接下来,围绕笔者手中这套AMD锐龙5600X和RX6800XT的组合作为测试例子,来见证下现如今的AMD究竟有多么Yse?首先说说CPU处理器部分,上一代采用ZEN2架构的AMD锐龙3000系列处理器其实已经令用
 内存频率和时序哪个对性能影响更大Feb 19, 2024 am 08:58 AM
内存是计算机中非常重要的组件之一,它对计算机的性能和稳定性有着重要影响。在选择内存时,人们往往会关注两个重要的参数,即时序和频率。那么,对于内存性能来说,时序和频率哪个更重要呢?首先,我们来了解一下时序和频率的概念。时序指的是内存芯片在接收和处理数据时所需的时间间隔。它通常以CL值(CASLatency)来表示,CL值越小,内存的处理速度越快。而频率则是内
 发生0x0000004e错误代表了什么问题Feb 18, 2024 pm 01:54 PM
0x0000004e是什么故障在计算机系统中,故障是一个常见的问题。当计算机遇到故障时,系统通常会因为无法正常运行而出现停机、崩溃或者出现错误提示。而在Windows系统中,有一个特定的故障代码0x0000004e,这是一个蓝屏错误代码,表示系统遇到了一个严重的错误。0x0000004e蓝屏错误是由于系统内核或驱动程序问题导致的。这种错误通常会导致计算机系统
 DaVinci Resolve Studio 已支持AMD显卡的AV1硬件编码Mar 06, 2024 pm 10:04 PM
最近新消息,lackMagic目前推出了达芬奇DaVinciResolveStudio视频编辑软件的18.5PublicBeta2公测版更新,为AMDRadeon显卡带来了AV1编码支持。更新到最新版本后,AMD显卡用户将能够在DaVinciResolveStudio中利用硬件加速来进行AV1编码。尽管官方并未具体指明支持的架构或型号,但预计所有的AMD显卡用户都可以尝试这一功能。2018年,AOMedia发布了全新的视频编码标准AV1(AOMediaVideoCodec1.0)。AV1是由多家
 Planet Mojo:从自走棋游戏Mojo Melee建起Web3游戏元宇宙Mar 14, 2024 pm 05:55 PM
成立于上个加密周期的热门元宇宙游戏项目们正在加速扩张。3月4日,Web3游戏元宇宙平台PlanetMojo宣布了其游戏生态的多个重要动态,包括预告即将推出跑酷游戏GoGoMojo、旗舰自走棋游戏MojoMelee推出新赛季“战之道”,以及为庆祝新赛季与MagicEden合作推出的首个ETH系列“WarBannerNFT”。另外,PlanetMojo还透露,他们计划在今年晚些时候推出MojoMelee的Android和iOS移动版本。这个项目在2021年底启动,经过在熊市中近两年的努力建设,即将在
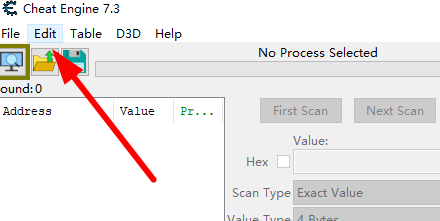 Cheat Engine如何设置中文?Cheat Engine设置中文方法Mar 13, 2024 pm 04:49 PM
CheatEngine是一款游戏编辑器,能够对游戏的内存进行编辑修改。但是它的默认语言是非中文的,对于很多小伙伴来说比较不方便,那么CheatEngine怎么设置中文呢?今天小编就给大家详细介绍一下CheatEngine设置中文的方法,希望可以帮助到你。 设置方法一 1、双击打开软件,点击左上角的“edit”。 2、接着点击下方选项列表中的“settings”。 3、在打开的窗口界面中,点击左侧栏中的“languages”
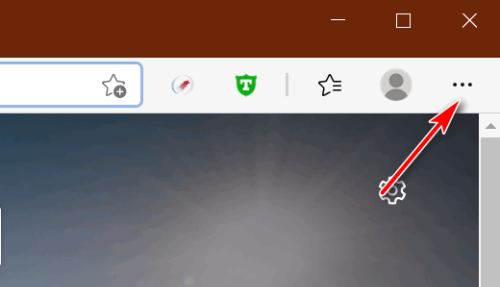 Microsoft Edge在哪设置显示下载按钮-Microsoft Edge设置显示下载按钮的方法Mar 06, 2024 am 11:49 AM
大家知道MicrosoftEdge在哪设置显示下载按钮吗?下文小编就带来了MicrosoftEdge设置显示下载按钮的方法,希望对大家能够有所帮助,一起跟着小编来学习一下吧!第一步:首先打开MicrosoftEdge浏览器,单击右上角【...】标识,如下图所示。第二步:然后在弹出菜单中,单击【设置】,如下图所示。第三步:接着单击界面左侧【外观】,如下图所示。第四步:最后单击【显示下载按钮】右侧按钮,由灰变蓝即可,如下图所示。上面就是小编为大家带来的MicrosoftEdge在哪设置显示下载按钮的


Hot AI Tools

Undresser.AI Undress
AI-powered app for creating realistic nude photos

AI Clothes Remover
Online AI tool for removing clothes from photos.

Undress AI Tool
Undress images for free

Clothoff.io
AI clothes remover

AI Hentai Generator
Generate AI Hentai for free.

Hot Article
Hot Tools

mPDF
mPDF is a PHP library that can generate PDF files from UTF-8 encoded HTML. The original author, Ian Back, wrote mPDF to output PDF files "on the fly" from his website and handle different languages. It is slower than original scripts like HTML2FPDF and produces larger files when using Unicode fonts, but supports CSS styles etc. and has a lot of enhancements. Supports almost all languages, including RTL (Arabic and Hebrew) and CJK (Chinese, Japanese and Korean). Supports nested block-level elements (such as P, DIV),

Safe Exam Browser
Safe Exam Browser is a secure browser environment for taking online exams securely. This software turns any computer into a secure workstation. It controls access to any utility and prevents students from using unauthorized resources.

MinGW - Minimalist GNU for Windows
This project is in the process of being migrated to osdn.net/projects/mingw, you can continue to follow us there. MinGW: A native Windows port of the GNU Compiler Collection (GCC), freely distributable import libraries and header files for building native Windows applications; includes extensions to the MSVC runtime to support C99 functionality. All MinGW software can run on 64-bit Windows platforms.

Notepad++7.3.1
Easy-to-use and free code editor

SublimeText3 Linux new version
SublimeText3 Linux latest version

