1. Commands to display information
console.log(); //Console input will not be output on the web page
console.info(); //General information
console.debug(); //Debug information
console.warn(); //Warning prompt
console.error(); //Error prompt
"console.log();" can be used to replace "alert();" or "document.write();" For example, write "console.log("Hello World");" in the web page and then It will be entered in the console, but not in the web page.
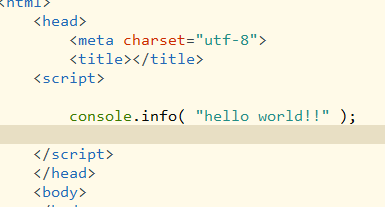

We insert the following code into the code:
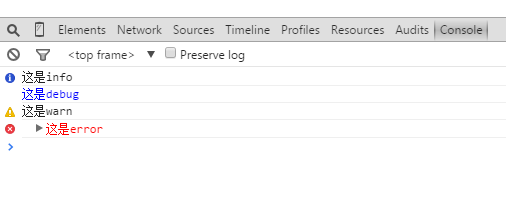
console.info( "This is info" );
console.debug( "This is debug" );
console.warn( "This is a warning" );
console.error( "This is error" );
After loading, open the console and you will see something like the following:
2. Placeholder
The above five methods of the console object can all use printf style placeholders. However, there are relatively few types of placeholders, and only four types of placeholders are supported: characters (%s), integers (%d or %i), floating point numbers (%f), and objects (%o). For example:
console.log( "%d year %d month %d day" , 2011,3,26);
console.log( "Pi is %f" , 3.1415926 );

%o placeholder can be used to view the internal conditions of an object. For example, there is such an object:
var dog = {} ;
dog.name = "大毛";
dog.color = "yellow";
Then, use the o% placeholder for it:
console.log( "%o" , dog );

3. Group display
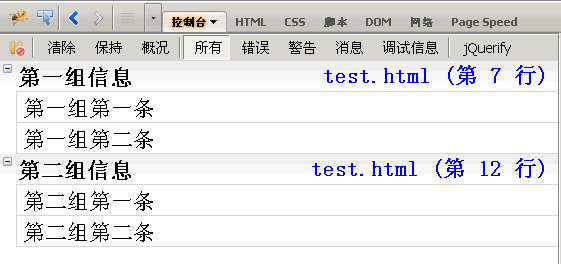
console.group(); console.groupEnd(); (这两个方法是成对使用的)
  console.group("第一组信息");
    console.log("第一组第一条");
    console.log("第一组第二条");
  console.groupEnd();
  console.group("第二组信息");
    console.log("第二组第一条");
    console.log("第二组第二条");
  console.groupEnd();
4. console.dir(); (displays all properties and methods of an object)
For example, now add a bark() method to the dog object in Section 2, and then use "dir();" to display it:
dog.bark = function(){ alert( "bark woof" ); };
console.dir( dog );

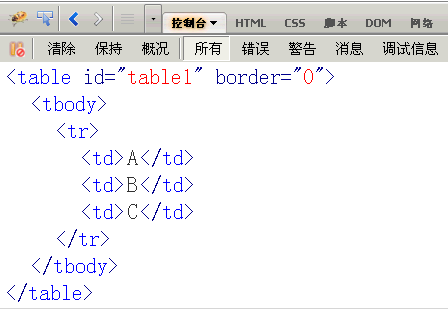
5. console.dirxml(); (get all html/xml codes contained in a node)
var table = document.getElementById("table1"); //Get node
console.dirxml( table ); //Display all codes of the node
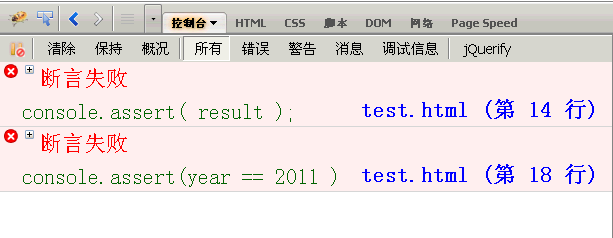
6. console.assert(); (used to determine whether an expression or variable is true. If the result is no, a corresponding message will be output on the console and an exception will be thrown)
var result = 0;
console.assert( result ); //false
var year = 2000;
console.assert( year == 2011 ); //false
7. console.trace(); (used to trace the function call trace)
/*An addition function*/
Function add( a,b ){
return a b;
}
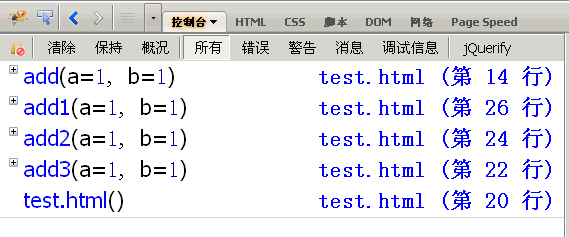
I want to know how this function is called, just add the console.trace() method to it:
Function add( a,b ){
console.trace();
return a b;
}
Assume that the calling code of this function is as follows:
var x = add3(1,1);
Function add3( a,b ){ return add2(a,b); }
Function add2( a,b ){ return add1( a,b ); }
Function add1( a,b ){ return add( a,b ); }
After running, the call trace of add() will be displayed, from top to bottom, add(), add1(), add2(), add3()
8. console.time(); and console.timeEnd(); (used to display the running time of the code)
  console.time( "计时器一" );

  for( var i=0;i<1000;i++ ){

    for(var j=0;j<1000;j++){}

  }

  console.timeEnd( "计时器一" );

9. Performance Analysis
Performance analysis (Profiler) is to analyze the running time of each part of the program and find out where the bottleneck is. The method used is console.profile();
Suppose there is a function Foo(), which calls two other functions funcA() and funcB(), of which funcA() is called 10 times and funcB() is called once.
  function Foo(){

    for(var i=0;i<10;i++){funcA(1000);}

    funcB(10000);

  }

  function funcA(count){

    for(var i=0;i<count;i++){}

  }

  function funcB(count){

    for(var i=0;i<count;i++){}

  }
Then analyze the running performance of “Foo();”:
  console.profile('性能分析器一');

  Foo();

  console.profileEnd();
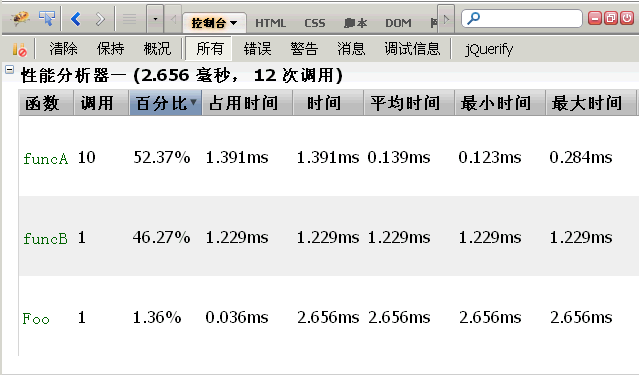
The title bar indicates that a total of 12 functions were run, taking a total of 2.656 milliseconds. Among them, funcA() runs 10 times, taking 1.391 milliseconds, the shortest running time is 0.123 milliseconds, the longest running time is 0.284 milliseconds, and the average is 0.139 milliseconds; funcB() runs once, taking 1.229ms.
In addition to using the "console.profile();" method, firebug also provides a "Profiler" button. When you click the button for the first time, "Performance Analysis" starts, and you can perform certain operations on the web page (such as ajax operations). Then when you click the button for the second time, "Performance Analysis" ends, and all operations triggered by this operation will be performed. Performance analysis.

10. Attribute menu
After the name of the console panel, there is an inverted triangle. When clicked, the properties menu will be displayed.
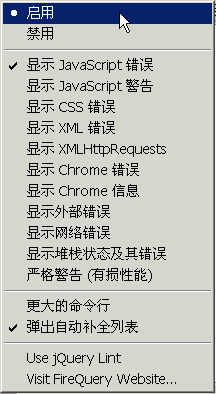
By default, the console only displays Javascript errors. If you select Send Javascript warnings, CSS errors, and XML errors, the relevant prompt information will be displayed.
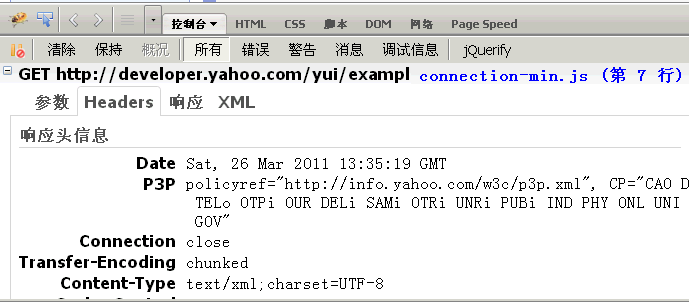
What is more useful here is to display "XMLHttpRequests", which is to display ajax requests. After selecting, all ajax requests of the web page will be displayed in the console panel.
For example, if you click on a YUI example, the console will tell us that it issued a GET request using ajax. The header information and content body of the http request and response can also be seen.
The above is the entire content of this article, I hope you all like it.
 Replace String Characters in JavaScriptMar 11, 2025 am 12:07 AM
Detailed explanation of JavaScript string replacement method and FAQ This article will explore two ways to replace string characters in JavaScript: internal JavaScript code and internal HTML for web pages. Replace string inside JavaScript code The most direct way is to use the replace() method: str = str.replace("find","replace"); This method replaces only the first match. To replace all matches, use a regular expression and add the global flag g: str = str.replace(/fi
 8 Stunning jQuery Page Layout PluginsMar 06, 2025 am 12:48 AM
Leverage jQuery for Effortless Web Page Layouts: 8 Essential Plugins jQuery simplifies web page layout significantly. This article highlights eight powerful jQuery plugins that streamline the process, particularly useful for manual website creation
 Build Your Own AJAX Web ApplicationsMar 09, 2025 am 12:11 AM
So here you are, ready to learn all about this thing called AJAX. But, what exactly is it? The term AJAX refers to a loose grouping of technologies that are used to create dynamic, interactive web content. The term AJAX, originally coined by Jesse J
 10 Mobile Cheat Sheets for Mobile DevelopmentMar 05, 2025 am 12:43 AM
This post compiles helpful cheat sheets, reference guides, quick recipes, and code snippets for Android, Blackberry, and iPhone app development. No developer should be without them! Touch Gesture Reference Guide (PDF) A valuable resource for desig
 Improve Your jQuery Knowledge with the Source ViewerMar 05, 2025 am 12:54 AM
jQuery is a great JavaScript framework. However, as with any library, sometimes it’s necessary to get under the hood to discover what’s going on. Perhaps it’s because you’re tracing a bug or are just curious about how jQuery achieves a particular UI
 10 jQuery Fun and Games PluginsMar 08, 2025 am 12:42 AM
10 fun jQuery game plugins to make your website more attractive and enhance user stickiness! While Flash is still the best software for developing casual web games, jQuery can also create surprising effects, and while not comparable to pure action Flash games, in some cases you can also have unexpected fun in your browser. jQuery tic toe game The "Hello world" of game programming now has a jQuery version. Source code jQuery Crazy Word Composition Game This is a fill-in-the-blank game, and it can produce some weird results due to not knowing the context of the word. Source code jQuery mine sweeping game
 How do I create and publish my own JavaScript libraries?Mar 18, 2025 pm 03:12 PM
Article discusses creating, publishing, and maintaining JavaScript libraries, focusing on planning, development, testing, documentation, and promotion strategies.
 jQuery Parallax Tutorial - Animated Header BackgroundMar 08, 2025 am 12:39 AM
This tutorial demonstrates how to create a captivating parallax background effect using jQuery. We'll build a header banner with layered images that create a stunning visual depth. The updated plugin works with jQuery 1.6.4 and later. Download the


Hot AI Tools

Undresser.AI Undress
AI-powered app for creating realistic nude photos

AI Clothes Remover
Online AI tool for removing clothes from photos.

Undress AI Tool
Undress images for free

Clothoff.io
AI clothes remover

AI Hentai Generator
Generate AI Hentai for free.

Hot Article

Hot Tools

Atom editor mac version download
The most popular open source editor

VSCode Windows 64-bit Download
A free and powerful IDE editor launched by Microsoft

MinGW - Minimalist GNU for Windows
This project is in the process of being migrated to osdn.net/projects/mingw, you can continue to follow us there. MinGW: A native Windows port of the GNU Compiler Collection (GCC), freely distributable import libraries and header files for building native Windows applications; includes extensions to the MSVC runtime to support C99 functionality. All MinGW software can run on 64-bit Windows platforms.

SublimeText3 Linux new version
SublimeText3 Linux latest version

mPDF
mPDF is a PHP library that can generate PDF files from UTF-8 encoded HTML. The original author, Ian Back, wrote mPDF to output PDF files "on the fly" from his website and handle different languages. It is slower than original scripts like HTML2FPDF and produces larger files when using Unicode fonts, but supports CSS styles etc. and has a lot of enhancements. Supports almost all languages, including RTL (Arabic and Hebrew) and CJK (Chinese, Japanese and Korean). Supports nested block-level elements (such as P, DIV),


