


In recent years, people have gained a deeper understanding of the importance of in-depth understanding of machine learning data (ML-data). However, since detecting large data sets usually requires a lot of human and material investment, its widespread application in the field of computer vision still requires further development.
Usually, in object detection (Object Detection, which is a subset of computer vision), objects in the image are positioned by defining bounding boxes, which can not only identify objects, but also Understand an object's context, size, and relationship to other elements in the scene. At the same time, a comprehensive understanding of the distribution of classes, the diversity of object sizes, and the common environments in which classes appear will also help to discover error patterns in the training model during evaluation and debugging, so that additional training data can be selected more targeted .
In practice, I often take the following approach:
- Use the enhanced functions of pre-trained models or basic models, Add structure to your data. For example: creating various image embeddings and employing dimensionality reduction techniques such as t-SNE or UMAP. These can generate similarity maps to facilitate data browsing. In addition, using pre-trained models for detection can also facilitate context extraction.
- Use visualization tools that can integrate such structures with statistical and review capabilities of the raw data.
Below, I will introduce how to use Renomics Spotlight to create interactive object detection visualizations. As an example, I will try to:
- Build a visualization for a person detector in an image.
- Visualizations include similarity maps, filters, and statistics for easy exploration of the data.
- View every image through ground truth and Ultralytics YOLOv8 detection details.

Download the character images in the COCO dataset
First, install the required software packages through the following command:
!pip install fiftyone ultralytics renumics-spotlightUsing
importpandasaspdimportnumpyasnpimportfiftyone.zooasfoz# 从 COCO 数据集中下载 1000 张带人的图像dataset = foz.load_zoo_dataset( "coco-2017"、split="validation"、label_types=[ "detections"、],classes=["person"]、 max_samples=1000、dataset_name="coco-2017-person-1k-validations"、)
Next, you can use the following code:
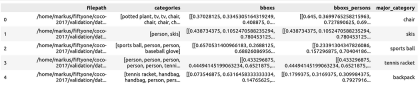
def xywh_too_xyxyn(bbox): "" convert from xywh to xyxyn format """ return[bbox[0], bbox[1], bbox[0] + bbox[2], bbox[1] + bbox[3]].行 = []fori, samplein enumerate(dataset):labels = [detection.labelfordetectioninsample.ground_truth.detections] bboxs = [...bboxs = [xywh_too_xyxyn(detection.bounding_box) fordetectioninsample.ground_truth.detections]bboxs_persons = [bboxforbbox, labelin zip(bboxs, labels)iflabel =="person"] 行。row.append([sample.filepath, labels, bboxs, bboxs_persons])df = pd.DataFrame(row, columns=["filepath","categories", "bboxs", "bboxs_persons"])df["major_category"] = df["categories"].apply( lambdax:max(set(x) -set(["person"]), key=x.count) if len(set(x)) >1 else "only person"。)
Prepare the data is a Pandas DataFrame with columns including: file path, bounding box category, bounding box, the person contained in the bounding box, and the main category (despite the person) to specify the context of the person in the image:
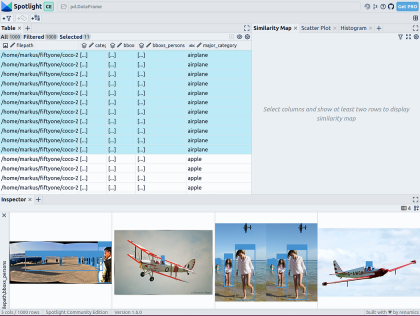
You can then visualize it via Spotlight:
From renumics import spotlightspotlight.show(df)
You can use Add View button in the inspector view and select bboxs_persons and filepath in the border view to display the corresponding border with the image:
Embed Rich data
To make the data structured, we can use image embedding of various basic models (ie: dense vector representation). To do this, you can use further dimensionality reduction techniques such as UMAP or t-SNE to apply Vision Transformer (ViT) embeddings of the entire image to the structuring of the dataset, thus providing a 2D similarity map of the image. Additionally, you can use the output of a pretrained object detector to structure your data by classifying it by the size or number of objects it contains. Since the COCO dataset already provides this information, we can use it directly.
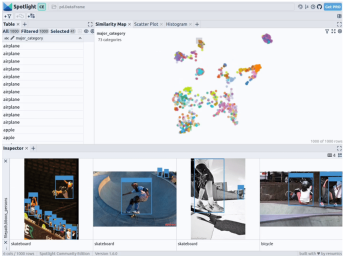
Since Spotlight integrates support for the google/vit-base-patch16-224-in21k (ViT) model and UMAP , So when you create various embeds using file paths, it will be automatically applied:
spotlight.show(df, embed=["filepath"])
通过上述代码,Spotlight 将各种嵌入进行计算,并应用 UMAP 在相似性地图中显示结果。其中,不同的颜色代表了主要的类别。据此,您可以使用相似性地图来浏览数据:
预训练YOLOv8的结果
可用于快速识别物体的Ultralytics YOLOv8,是一套先进的物体检测模型。它专为快速图像处理而设计,适用于各种实时检测任务,特别是在被应用于大量数据时,用户无需浪费太多的等待时间。
为此,您可以首先加载预训练模型:
From ultralytics import YOLOdetection_model = YOLO("yolov8n.pt")并执行各种检测:
detections = []forfilepathindf["filepath"].tolist():detection = detection_model(filepath)[0]detections.append({ "yolo_bboxs":[np.array(box.xyxyn.tolist())[0]forboxindetection.boxes]、 "yolo_conf_persons": np.mean([np.array(box.conf.tolist())[0]. forboxindetection.boxes ifdetection.names[int(box.cls)] =="person"]), np.mean(]), "yolo_bboxs_persons":[np.array(box.xyxyn.tolist())[0] forboxindetection.boxes ifdetection.names[int(box.cls)] =="person],"yolo_categories": np.array([np.array(detection.names[int(box.cls)])forboxindetection.boxes], "yolo_categories": np.array(),})df_yolo = pd.DataFrame(detections)在12gb的GeForce RTX 4070 Ti上,上述过程在不到20秒的时间内便可完成。接着,您可以将结果包含在DataFrame中,并使用Spotlight将其可视化。请参考如下代码:
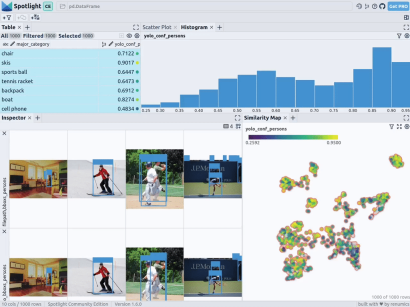
df_merged = pd.concat([df, df_yolo], axis=1)spotlight.show(df_merged, embed=["filepath"])
下一步,Spotlight将再次计算各种嵌入,并应用UMAP到相似度图中显示结果。不过这一次,您可以为检测到的对象选择模型的置信度,并使用相似度图在置信度较低的集群中导航检索。毕竟,鉴于这些图像的模型是不确定的,因此它们通常有一定的相似度。
当然,上述简短的分析也表明了,此类模型在如下场景中会遇到系统性的问题:
- 由于列车体积庞大,站在车厢外的人显得非常渺小
- 对于巴士和其他大型车辆而言,车内的人员几乎看不到
- 有人站在飞机的外面
- 食物的特写图片上有人的手或手指
您可以判断这些问题是否真的会影响您的人员检测目标,如果是的话,则应考虑使用额外的训练数据,来增强数据集,以优化模型在这些特定场景中的性能。
小结
综上所述,预训练模型和 Spotlight 等工具的使用,可以让我们的对象检测可视化过程变得更加容易,进而增强数据科学的工作流程。您可以使用自己的数据去尝试和体验上述代码。
译者介绍
陈峻(Julian Chen),51CTO社区编辑,具有十多年的IT项目实施经验,善于对内外部资源与风险实施管控,专注传播网络与信息安全知识与经验。
原文标题:How to Explore and Visualize ML-Data for Object Detection in Images,作者:Markus Stoll
链接:https://itnext.io/how-to-explore-and-visualize-ml-data-for-object-detection-in-images-88e074f46361。
The above is the detailed content of How to explore and visualize ML data for object detection in images. For more information, please follow other related articles on the PHP Chinese website!

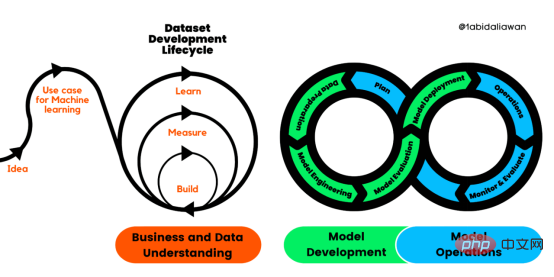 解读CRISP-ML(Q):机器学习生命周期流程Apr 08, 2023 pm 01:21 PM
译者 | 布加迪审校 | 孙淑娟目前,没有用于构建和管理机器学习(ML)应用程序的标准实践。机器学习项目组织得不好,缺乏可重复性,而且从长远来看容易彻底失败。因此,我们需要一套流程来帮助自己在整个机器学习生命周期中保持质量、可持续性、稳健性和成本管理。图1. 机器学习开发生命周期流程使用质量保证方法开发机器学习应用程序的跨行业标准流程(CRISP-ML(Q))是CRISP-DM的升级版,以确保机器学习产品的质量。CRISP-ML(Q)有六个单独的阶段:1. 业务和数据理解2. 数据准备3. 模型
 2023年机器学习的十大概念和技术Apr 04, 2023 pm 12:30 PM
机器学习是一个不断发展的学科,一直在创造新的想法和技术。本文罗列了2023年机器学习的十大概念和技术。 本文罗列了2023年机器学习的十大概念和技术。2023年机器学习的十大概念和技术是一个教计算机从数据中学习的过程,无需明确的编程。机器学习是一个不断发展的学科,一直在创造新的想法和技术。为了保持领先,数据科学家应该关注其中一些网站,以跟上最新的发展。这将有助于了解机器学习中的技术如何在实践中使用,并为自己的业务或工作领域中的可能应用提供想法。2023年机器学习的十大概念和技术:1. 深度神经网
 基于因果森林算法的决策定位应用Apr 08, 2023 am 11:21 AM
译者 | 朱先忠审校 | 孙淑娟在我之前的博客中,我们已经了解了如何使用因果树来评估政策的异质处理效应。如果你还没有阅读过,我建议你在阅读本文前先读一遍,因为我们在本文中认为你已经了解了此文中的部分与本文相关的内容。为什么是异质处理效应(HTE:heterogenous treatment effects)呢?首先,对异质处理效应的估计允许我们根据它们的预期结果(疾病、公司收入、客户满意度等)选择提供处理(药物、广告、产品等)的用户(患者、用户、客户等)。换句话说,估计HTE有助于我
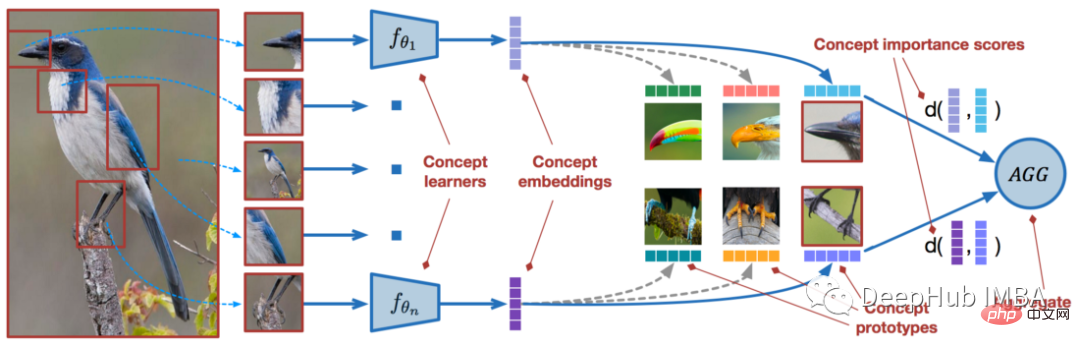 使用PyTorch进行小样本学习的图像分类Apr 09, 2023 am 10:51 AM
近年来,基于深度学习的模型在目标检测和图像识别等任务中表现出色。像ImageNet这样具有挑战性的图像分类数据集,包含1000种不同的对象分类,现在一些模型已经超过了人类水平上。但是这些模型依赖于监督训练流程,标记训练数据的可用性对它们有重大影响,并且模型能够检测到的类别也仅限于它们接受训练的类。由于在训练过程中没有足够的标记图像用于所有类,这些模型在现实环境中可能不太有用。并且我们希望的模型能够识别它在训练期间没有见到过的类,因为几乎不可能在所有潜在对象的图像上进行训练。我们将从几个样本中学习
 LazyPredict:为你选择最佳ML模型!Apr 06, 2023 pm 08:45 PM
本文讨论使用LazyPredict来创建简单的ML模型。LazyPredict创建机器学习模型的特点是不需要大量的代码,同时在不修改参数的情况下进行多模型拟合,从而在众多模型中选出性能最佳的一个。 摘要本文讨论使用LazyPredict来创建简单的ML模型。LazyPredict创建机器学习模型的特点是不需要大量的代码,同时在不修改参数的情况下进行多模型拟合,从而在众多模型中选出性能最佳的一个。本文包括的内容如下:简介LazyPredict模块的安装在分类模型中实施LazyPredict
 Mango:基于Python环境的贝叶斯优化新方法Apr 08, 2023 pm 12:44 PM
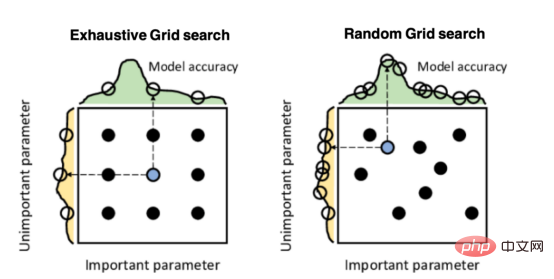
译者 | 朱先忠审校 | 孙淑娟引言模型超参数(或模型设置)的优化可能是训练机器学习算法中最重要的一步,因为它可以找到最小化模型损失函数的最佳参数。这一步对于构建不易过拟合的泛化模型也是必不可少的。优化模型超参数的最著名技术是穷举网格搜索和随机网格搜索。在第一种方法中,搜索空间被定义为跨越每个模型超参数的域的网格。通过在网格的每个点上训练模型来获得最优超参数。尽管网格搜索非常容易实现,但它在计算上变得昂贵,尤其是当要优化的变量数量很大时。另一方面,随机网格搜索是一种更快的优化方法,可以提供更好的
 超参数优化比较之网格搜索、随机搜索和贝叶斯优化Apr 04, 2023 pm 12:05 PM
本文将详细介绍用来提高机器学习效果的最常见的超参数优化方法。 译者 | 朱先忠审校 | 孙淑娟简介通常,在尝试改进机器学习模型时,人们首先想到的解决方案是添加更多的训练数据。额外的数据通常是有帮助(在某些情况下除外)的,但生成高质量的数据可能非常昂贵。通过使用现有数据获得最佳模型性能,超参数优化可以节省我们的时间和资源。顾名思义,超参数优化是为机器学习模型确定最佳超参数组合以满足优化函数(即,给定研究中的数据集,最大化模型的性能)的过程。换句话说,每个模型都会提供多个有关选项的调整“按钮
 人工智能自动获取知识和技能,实现自我完善的过程是什么Aug 24, 2022 am 11:57 AM
实现自我完善的过程是“机器学习”。机器学习是人工智能核心,是使计算机具有智能的根本途径;它使计算机能模拟人的学习行为,自动地通过学习来获取知识和技能,不断改善性能,实现自我完善。机器学习主要研究三方面问题:1、学习机理,人类获取知识、技能和抽象概念的天赋能力;2、学习方法,对生物学习机理进行简化的基础上,用计算的方法进行再现;3、学习系统,能够在一定程度上实现机器学习的系统。


Hot AI Tools

Undresser.AI Undress
AI-powered app for creating realistic nude photos

AI Clothes Remover
Online AI tool for removing clothes from photos.

Undress AI Tool
Undress images for free

Clothoff.io
AI clothes remover

AI Hentai Generator
Generate AI Hentai for free.

Hot Article
Hot Tools

Zend Studio 13.0.1
Powerful PHP integrated development environment

mPDF
mPDF is a PHP library that can generate PDF files from UTF-8 encoded HTML. The original author, Ian Back, wrote mPDF to output PDF files "on the fly" from his website and handle different languages. It is slower than original scripts like HTML2FPDF and produces larger files when using Unicode fonts, but supports CSS styles etc. and has a lot of enhancements. Supports almost all languages, including RTL (Arabic and Hebrew) and CJK (Chinese, Japanese and Korean). Supports nested block-level elements (such as P, DIV),

Notepad++7.3.1
Easy-to-use and free code editor

ZendStudio 13.5.1 Mac
Powerful PHP integrated development environment

VSCode Windows 64-bit Download
A free and powerful IDE editor launched by Microsoft

