
Home >System Tutorial >LINUX >Understand the health status of Linux in 61 seconds!
Understand the health status of Linux in 61 seconds!

- WBOYWBOYWBOYWBOYWBOYWBOYWBOYWBOYWBOYWBOYWBOYWBOYWBforward
- 2024-02-14 10:45:021357browse
As the foundation of all programs, the operating system has an important impact on the performance of applications. However, the speed differences between the various components of a computer are very large. For example, the speed difference between a CPU and a hard drive is greater than the speed difference between a rabbit and a tortoise.
Below, we will briefly introduce the basics of CPU, memory and I/O, and introduce some commands to evaluate their performance.
1.CPU
First introduce the most important computing component in the computer: the central processing unit. Generally we can observe its performance through the top command.
1.1 top command
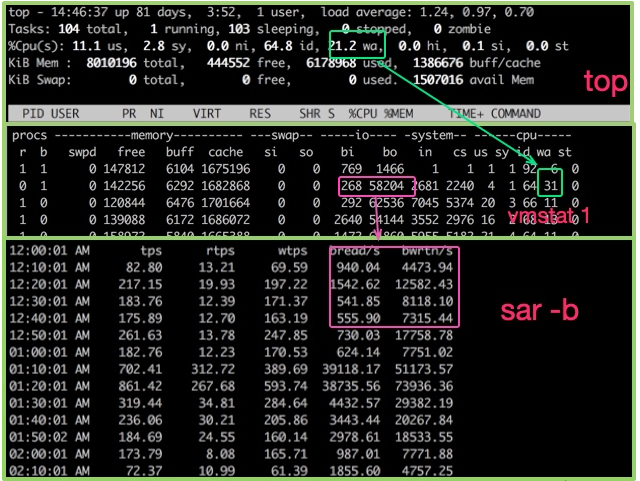
Thetop command can be used to observe some operating indicators of the CPU. As shown in the figure, after entering the top command, press the 1 key to see the detailed status of each core CPU.
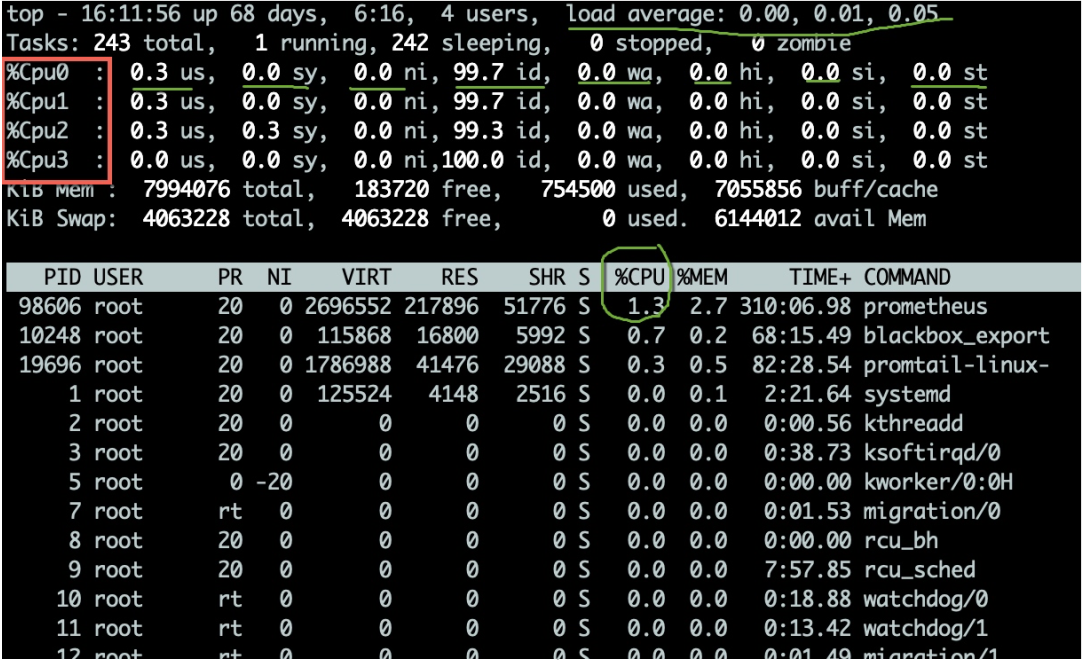
CPU usage has multiple indicators, which are explained below:
- us The percentage of CPU occupied by user mode.
- sy Percentage of CPU occupied by kernel mode. If this value is too high, you need to cooperate with the vmstat command to check whether context switching is frequent.
- ni The percentage of CPU occupied by high-priority applications.
- wa The percentage of CPU occupied by waiting for I/O devices. If this value is very high, there may be a significant bottleneck in the input and output device.
- hi Percentage of CPU occupied by hardware interrupts.
- si The percentage of CPU occupied by soft interrupts.
- st This generally occurs on virtual machines and refers to the percentage of time the virtual CPU waits for the actual CPU. If this value is too large, your host may be under too much pressure. If you are a cloud host, your service provider may be overselling.
- id Idle CPU percentage.
Generally, we pay more attention to the percentage of idle CPU, which can reflect the overall CPU utilization.
1.2 What is load
We also need to evaluate the queuing situation of CPU task execution. These values are load(load). The CPU load displayed by the top command is the values of the last 1 minute, 5 minutes, and 15 minutes respectively.
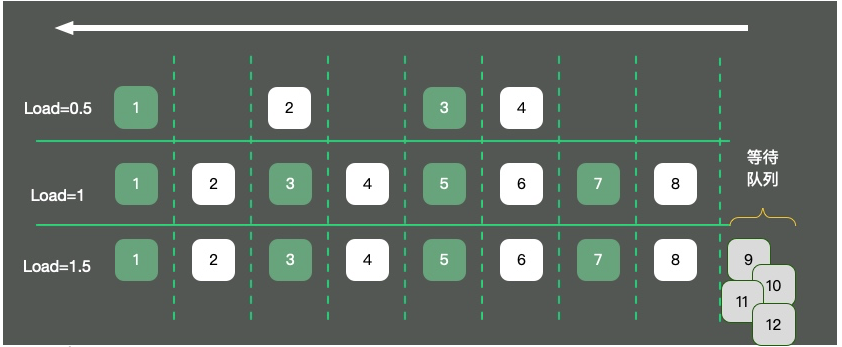
As shown in the figure, taking a single-core operating system as an example, the CPU resources are abstracted into a one-way road. Three situations will occur:
-
There are only
4cars on the road, the traffic is flowing smoothly, and the load is about 0.5. - There are 8 cars on the road, which can pass safely end to end. At this time, the load is about 1.
- There are 12 cars on the road. In addition to the 8 cars on the road, there are 4 cars waiting outside the road and need to queue up. At this time the load is about 1.5.
What does load 1 mean? There are still many misunderstandings about this issue.
Many students believe that when the load reaches 1, the system reaches a bottleneck. This is not entirely correct. The value of load is closely related to the number of CPU cores. Examples are as follows:
- The load of a single core reaches 1, and the total load value is about 1.
- The load on each core of the dual-core reaches 1, and the total load is about 2.
- Each of the four cores has a load of 1, and the total load is about 4.
So, for a machine that is loaded to 10 but has 16 cores, your system is far from reaching the load limit. Through the uptime command, you can also see the load status.
1.3 vmstat
To see how busy the CPU is, you can also use the vmstat command. The following is some output information from the vmstat command.
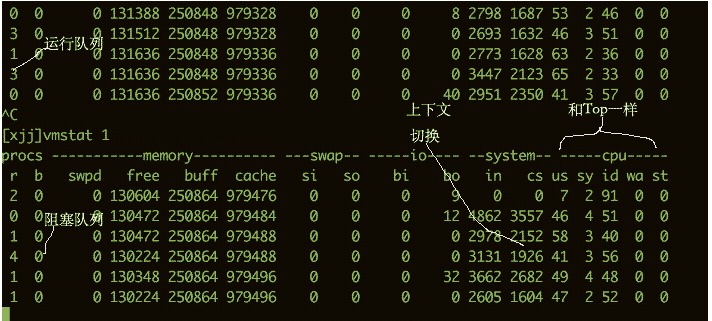
We are more concerned about the following columns:
-
bThe number of kernel threads existing in the waiting queue, such as waiting for I/O, etc. If the number is too large, the CPU will be too busy. -
csrepresents the number of context switches. If context switches are performed frequently, you need to consider whether the number of threads is too many. -
si/soshows some usage of the swap partition. The swap partition has a greater impact on performance and requires special attention.
$ vmstat 1
procs ---------memory---------- ---swap-- -----io---- -system-- ------cpu-----
 r  b swpd   free   buff  cache   si   so    bi    bo   in   cs us sy id wa st
34  0    0 200889792  73708 591828    0    0     0     5    6   10 96  1  3  0  0
32  0    0 200889920  73708 591860    0    0     0   592 13284 4282 98  1  1  0  0
32  0    0 200890112  73708 591860    0    0     0     0 9501 2154 99  1  0  0  0
32  0    0 200889568  73712 591856    0    0     0    48 11900 2459 99  0  0  0  0
32  0    0 200890208  73712 591860    0    0     0     0 15898 4840 98  1  1  0  0
^C
2.Memory
2.1 Observation command
If you want to understand some of the impact of memory on performance, you need to look at the distribution of memory from the operating system level.
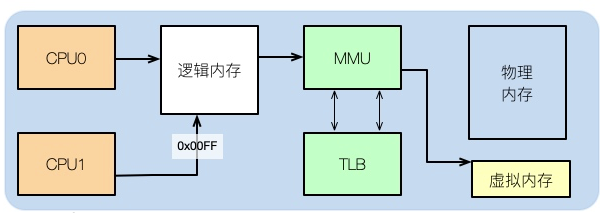
After we usually write the code, for example, if we write a C program, if we look at its assembly, we can see that the memory address in it is not the actual physical memory address.
Then what the application uses is logical memory. Students who have studied the structure of computers all know this.
Logical addresses can be mapped to physical memory and virtual memory. For example, if your physical memory is 8GB and a 16GB SWAP partition is allocated, then the total memory available to the application is 24GB.
You can see several columns of data from the top command. Pay attention to the three areas enclosed by squares. The explanation is as follows:
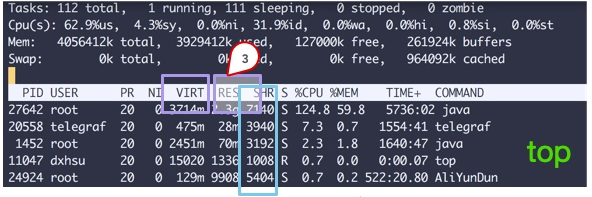
- VIRT This is the virtual memory, which is generally relatively large, so you don’t need to pay too much attention to it.
- RES What we usually pay attention to is the value of this column, which represents the memory actually occupied by the process. Usually when doing monitoring, this value is mainly monitored.
- SHR refers to shared memory, such as some so files that can be reused.
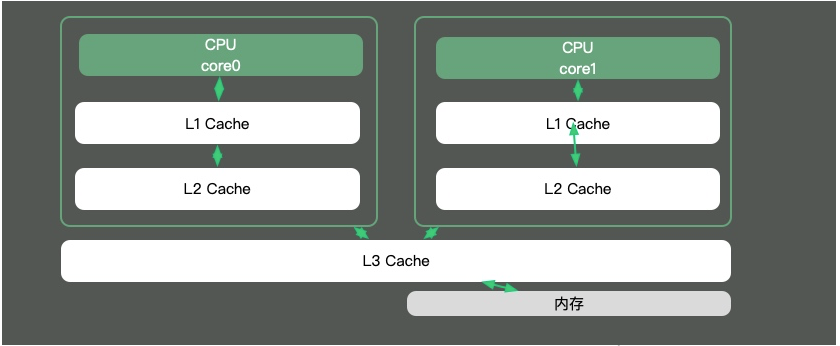
2.2 CPU cache
Since the speed difference between CPU cores and memories is very large, the solution is to add cache. In fact, these caches often have multiple layers, as shown in the figure below.
Most of the knowledge points in Java are around multi-threading. That is because if the time slice of a thread spans multiple CPUs, then there will be synchronization problems.
在Java中,最典型的和CPU缓存相关的知识点,就是并发编程中,针对Cache line的伪共享(false sharing)问题。
伪共享是指:在这些高速缓存中,是以缓存行为单位进行存储的。哪怕你修改了缓存行中一个很小很小的数据,它都会整个的刷新。所以,当多线程修改一些变量的值时,如果这些变量在同一个缓存行里,就会造成频繁刷新,无意中影响彼此的性能。
通过以下命令即可看到当前操作系统的缓存行大小。
cat /sys/devices/system/cpu/cpu0/cache/index0/coherency_line_size
通过以下命令可以看到不同层次的缓存大小。
[root@localhost ~]# cat /sys/devices/system/cpu/cpu0/cache/index1/size
32K
[root@localhost ~]# cat /sys/devices/system/cpu/cpu0/cache/index2/size
256K
[root@localhost ~]# cat /sys/devices/system/cpu/cpu0/cache/index3/size
20480K
在JDK8以上的版本,通过开启参数-XX:-RestrictContended,就可以使用注解@sun.misc.Contended进行补齐,来避免伪共享的问题。在并发优化中,我们再详细讲解。
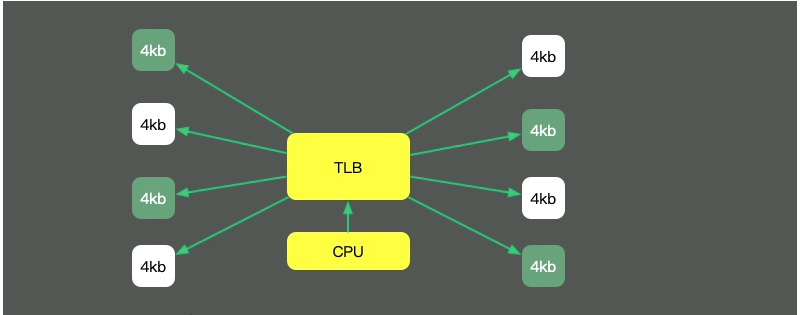
2.3 HugePage
回头看我们最长的那副图,上面有一个叫做TLB的组件,它的速度虽然高,但容量也是有限的。这就意味着,如果物理内存很大,那么映射表的条目将会非常多,会影响CPU的检索效率。
默认内存是以4K的page来管理的。如图,为了减少映射表的条目,可采取的办法只有增加页的尺寸。像这种将Page Size加大的技术,就是Huge Page。
HugePage有一些副作用,比如竞争加剧,Redis还有专门的研究(https://redis.io/topics/latency) ,但在一些大内存的机器上,开启后会一定程度上增加性能。
2.4 预先加载
另外,一些程序的默认行为,也会对性能有所影响。比如JVM的-XX:+AlwaysPreTouch参数。默认情况下,JVM虽然配置了Xmx、Xms等参数,但它的内存在真正用到时,才会分配。
但如果加上这个参数,JVM就会在启动的时候,把所有的内存预先分配。这样,启动时虽然慢了些,但运行时的性能会增加。
3.I/O
3.1 观测命令
I/O设备可能是计算机里速度最差的组件了。它指的不仅仅是硬盘,还包括外围的所有设备。
硬盘有多慢呢?我们不去探究不同设备的实现细节,直接看它的写入速度(数据未经过严格测试,仅作参考)。
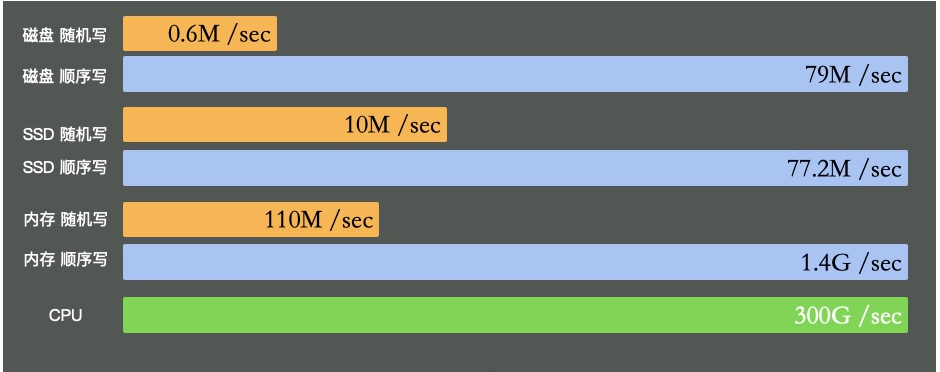
可以看到普通磁盘的随机写和顺序写相差是非常大的。而随机写完全和cpu内存不在一个数量级。
缓冲区依然是解决速度差异的唯一工具,在极端情况比如断电等,就产生了太多的不确定性。这些缓冲区,都容易丢。
The best way to reflect the busyness of I/O is the wa% in the top command and the vmstat command. If your application writes a lot of logs, I/O wait may be very high.
For hard disks, you can use the iostat command to view specific hardware usage. As long as %util exceeds 80%, your system will basically not be able to run.
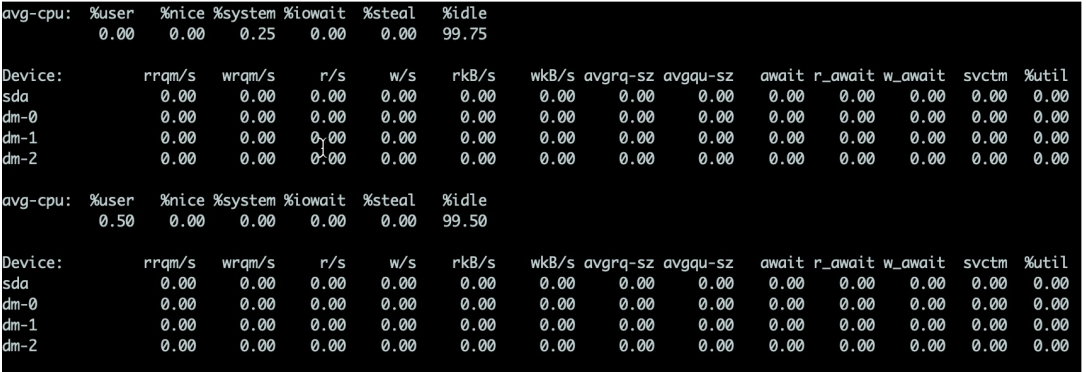
The details are as follows:
- %util The most important judgment parameter. Generally, if this parameter is 100%, it means that the device is running close to full capacity
- Device indicates which hard disk the event occurred on. If how fast you are, multiple lines will be displayed
- avgqu-sz This value is the saturation of the request queue, which is the average request queue length. There is no doubt that the shorter the queue length, the better.
- await The response time should be less than 5ms, if it is greater than 10ms, it will be larger. This time includes queue time and service time
-
svctm represents the average service time of each device
I/Ooperation. If the value ofsvctmis very close toawait, it means there is almost noI/Owaiting and the disk performance is very good. If the value ofawaitA value that is much higher thansvctmmeans that theI/Oqueue is waiting too long and applications running on the system will slow down.
3.2 Zero copy
One reason why kafka is faster is the use of zero copy. The so-called Zero copy means that when operating data, there is no need to copy the data buffer from one memory area to another. Because there is one less copy of memory, the efficiency of the CPU is improved.
Let’s take a look at the differences between them:
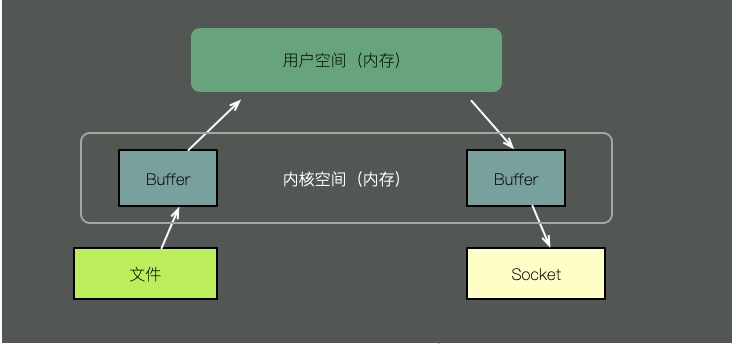
To send the contents of a file through a socket, the traditional method requires the following steps:
- Copy the file contents to kernel space.
- Copy the contents of the kernel space to user space memory, such as a Java application.
- User space writes content to the kernel space cache.
- The socket reads the contents of the kernel cache and sends them out.
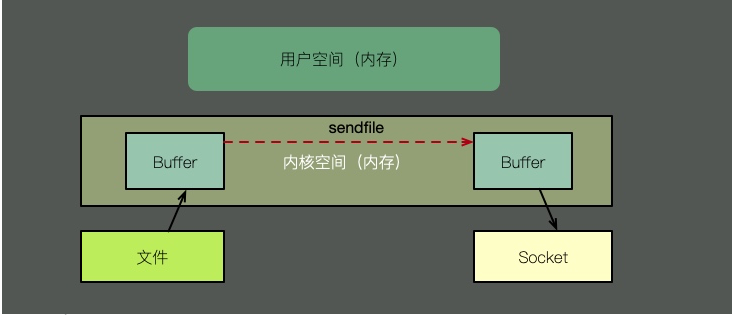
Zero copy has multiple modes. Let’s use sendfile to illustrate. As shown in the figure above, with the support of the kernel, zero copy has one less step, which is the copy of the kernel cache to user space. That is to say, it saves memory and CPU scheduling time, which is very efficient.
4.网络
除了iotop、iostat这些命令外,sar命令可以方便的看到网络运行状况,下面是一个简单的示例,用于描述入网流量和出网流量。
$ sar -n DEV 1
Linux 3.13.0-49-generic (titanclusters-xxxxx)  07/14/2015     _x86_64_    (32 CPU)

12:16:48 AM     IFACE   rxpck/s   txpck/s    rxkB/s    txkB/s   rxcmp/s   txcmp/s  rxmcst/s   %ifutil
12:16:49 AM      eth0  18763.00   5032.00  20686.42    478.30      0.00      0.00      0.00      0.00
12:16:49 AM        lo     14.00     14.00      1.36      1.36      0.00      0.00      0.00      0.00
12:16:49 AM   docker0      0.00      0.00      0.00      0.00      0.00      0.00      0.00      0.00

12:16:49 AM     IFACE   rxpck/s   txpck/s    rxkB/s    txkB/s   rxcmp/s   txcmp/s  rxmcst/s   %ifutil
12:16:50 AM      eth0  19763.00   5101.00  21999.10    482.56      0.00      0.00      0.00      0.00
12:16:50 AM        lo     20.00     20.00      3.25      3.25      0.00      0.00      0.00      0.00
12:16:50 AM   docker0      0.00      0.00      0.00      0.00      0.00      0.00      0.00      0.00
^C
当然,我们可以选择性的只看TCP的一些状态。
$ sar -n TCP,ETCP 1
Linux 3.13.0-49-generic (titanclusters-xxxxx)  07/14/2015    _x86_64_    (32 CPU)

12:17:19 AM  active/s passive/s    iseg/s    oseg/s
12:17:20 AM      1.00      0.00  10233.00  18846.00

12:17:19 AM  atmptf/s  estres/s retrans/s isegerr/s   orsts/s
12:17:20 AM      0.00      0.00      0.00      0.00      0.00

12:17:20 AM  active/s passive/s    iseg/s    oseg/s
12:17:21 AM      1.00      0.00   8359.00   6039.00

12:17:20 AM  atmptf/s  estres/s retrans/s isegerr/s   orsts/s
12:17:21 AM      0.00      0.00      0.00      0.00      0.00
^C
5.End
不要寄希望于这些指标,能够立刻帮助我们定位性能问题。这些工具,只能够帮我们大体猜测发生问题的地方,它对性能问题的定位,只是起到辅助作用。想要分析这些bottleneck,需要收集更多的信息。
想要获取更多的性能数据,就不得不借助更加专业的工具,比如基于eBPF的BCC工具,这些牛x的工具我们将在其他文章里展开。读完本文,希望你能够快速的了解Linux的运行状态,对你的系统多一些掌控。
The above is the detailed content of Understand the health status of Linux in 61 seconds!. For more information, please follow other related articles on the PHP Chinese website!