
Home >System Tutorial >LINUX >How to optimize the I/O performance of Linux systems and improve work efficiency?
How to optimize the I/O performance of Linux systems and improve work efficiency?

- WBOYWBOYWBOYWBOYWBOYWBOYWBOYWBOYWBOYWBOYWBOYWBOYWBforward
- 2024-02-10 22:45:19831browse
In Linux systems, I/O operations are one of the key factors in system performance. However, many users may not understand how to improve system performance and response speed by optimizing I/O operations. Today we will introduce how to optimize I/O performance on Linux systems and help you better utilize system resources and improve work efficiency.
An online server alarmed, the disk utilization disk.util > 90, and the alarm continued. After logging in to the server, run iostat -x 1 10 to view relevant disk usage information.
View related disk usage information through iostat -x 1 10
Relevant screenshots are as follows:
1 # 如果没有 iostat 命令,那么使用 yum install sysstat 进行安装
2 # iostat -x 1 10
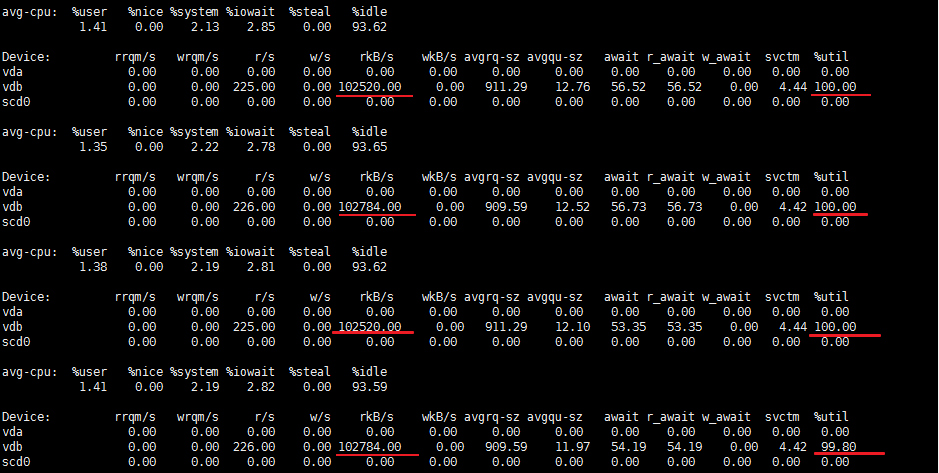
As can be seen from the above figure, the %util [IO] of the vdb disk is almost 100%, which is caused by frequent data reading.
Other field description
Device:设备名称
tps:每秒的IO读、写请求数量,多个逻辑请求可以组合成对设备的单个I/O请求。
Blk_read/s (kB_read/s, MB_read/s):从设备读取的数据量,以每秒若干块(千字节、兆字节)表示。块相当于扇区,因此块大小为512字节。
Blk_wrtn/s (kB_wrtn/s, MB_wrtn/s):写入设备的数据量,以每秒若干块(千字节、兆字节)表示。块相当于扇区,因此块大小为512字节。
Blk_read (kB_read, MB_read):读取块的总数(千字节、兆字节)。
Blk_wrtn (kB_wrtn, MB_wrtn):写入块的总数(千字节,兆字节)。

rrqm/s:每秒合并到设备的读请求数。即delta(rmerge)/s
wrqm/s:每秒合并到设备的写入请求数。即delta(wmerge)/s
r/s:每秒完成的读I/O设备次数。即delta(rio)/s
w/s:每秒完成的写I/0设备次数。即delta(wio)/s
rsec/s (rkB/s, rMB/s):每秒读取设备的扇区数(千字节、兆字节)。每扇区大小为512字节
wsec/s (wkB/s, wMB/s):每秒写入设备的扇区数(千字节、兆字节)。每扇区大小为512字节

avgrq-sz:平均每次设备I/O操作的数据量(扇区为单位)。即delta(rsec+wsec)/delta(rio+wio)
avgqu-sz:平均每次发送给设备的I/O队列长度。
await:平均每次IO请求等待时间。(包括等待队列时间和处理时间,毫秒为单位)
r_await:平均每次IO读请求等待时间。(包括等待队列时间和处理时间,毫秒为单位)
w_await:平均每次IO写请求等待时间。(包括等待队列时间和处理时间,毫秒为单位)
svctm:平均每次设备I/O操作的处理时间(毫秒)。警告!不要再相信这个字段值,这个字段将在将来的sysstat版本中删除。
%util:一秒中有百分之多少的时间用于I/O操作,或者说一秒中有多少时间I/O队列是非空的。当该值接近100%时,设备饱和发生。
Find the process with high IO usage
Through iotop command
If this command is not available, please install it through yum install iotop.
# iotop -oP
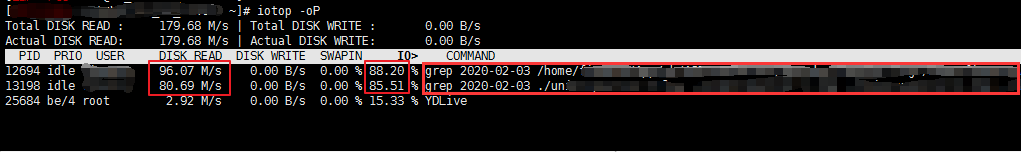
You can see more detailed information through this command, such as: process number, disk read volume, disk write volume, IO percentage, what commands are involved. "Both are IO reads caused by the grep command. Take a large amount."
Through the pidstat command
1 # 命令的含义:展示I/O统计,每秒更新一次
2 # pidstat -d 1
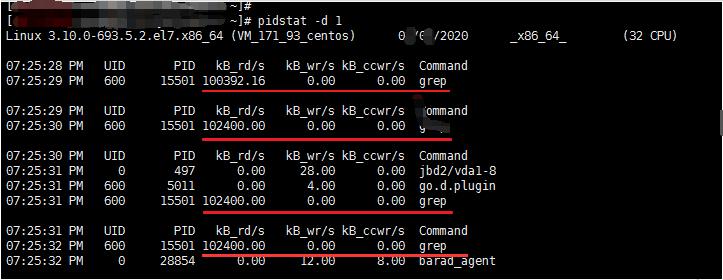
It can be seen that the grep command takes up a lot of read IO, and then the relevant process information can be viewed based on the PID.
Note: The PID of this picture is different from that of the above picture. The reason is that the process involved in the above picture has been executed. This picture is the process generated by subsequent execution [the same script is executed].
Through this article, we learned how to optimize I/O performance on Linux systems, including reducing disk I/O, using appropriate file systems, and using RAID and other technologies. These methods can significantly improve system response speed and effectively utilize system resources. Although I/O performance optimization is not a simple matter, with the right methods and tools, you can easily achieve this goal.
The above is the detailed content of How to optimize the I/O performance of Linux systems and improve work efficiency?. For more information, please follow other related articles on the PHP Chinese website!