

The details of Microsoft's AIOps work revealed

Dynamic measurement, these data are mainly divided into two categories: time series data and event data. Time series data refers to real-valued time series (usually with fixed time intervals), such as CPU usage, etc.; while event data refers to the sequence that records the occurrence of specific events, such as memory overflow events. In order to ensure product service quality, reduce service downtime, and avoid greater economic losses, the diagnosis of key service events is particularly important. In actual operation and maintenance work, when diagnosing service events, operation and maintenance personnel can analyze the cause of the event by analyzing the time series data related to the service event. Although this correlation cannot completely accurately reflect the true cause-and-effect relationship, it can still provide some good clues and revelations for diagnosis.
Then the question is, how to automatically determine the relationship between events and time series data?
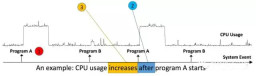
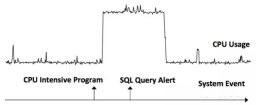
questionIn this article, the author transforms the problem of event (E) and time series (S) data correlation into a two-sample problem, and uses the nearest neighbor method to determine whether they are related. Mainly answered three questions: A. Is there a correlation between E and S? B. If there is a correlation, what is the chronological order of E and S? E happens first, or S happens first? C. The monotonic relationship between E and S. Assuming that S (or E) occurs first, does the increase or decrease of S cause E to occur? As shown in the figure, the events are the running of programs A and B, and the timing data is the CPU usage. It can be found that there is a correlation between the event (running of program A) and the timing data (CPU usage), and it is the change in CPU usage that increases after program A is run.
The algorithm architecture of the article is mainly divided into three parts to solve the three problems of correlation, time sequence and monotonicity respectively. These three parts will be introduced in detail next.
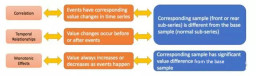
The article transforms the judgment of correlation into a two-sample problem. The core of the two-sample hypothesis test is to determine whether the two samples come from the same distribution. First, select N segments of time series sample data with length k corresponding before (or after) the event, represented by A1. Sample group A2 randomly selects a series of sample data of length k from the time series. The sample set is A1 and goes up to A2. If E and S are related, then the distributions of A1 and A2 are different, otherwise the distributions are the same. How to determine whether the distributions of A1 and A2 are the same? Let’s look at the following example:
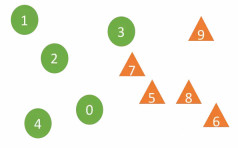
In the above figure, samples 0-4 are from sample group A1, and 5-9 belong to sample group A2. The DTW algorithm is used to calculate the distance between the two samples (the DTW algorithm can be well adapted to the scaling of sequence data and displacement). For a sample X belonging to sample group Ai (i=1 or 2), for the r nearest neighbor samples of E and S are more related. For example, if the number of neighbors is r=2, the two nearest neighbors of sample 7 are 3 and 5 from two different sample groups, but the two nearest neighbors of sample 5 are 7 and 8 from the same sample group A2. The article uses the confidence coefficient (Confident coefficient) to judge the credibility of "hypothesis test H1" (the two distributions are not the same, that is, E and S are related). The greater the confidence coefficient, the more credible H1 is. There are two key parameters of the algorithm: the number of nearest neighbors r and the time series length k. The number of neighbors is the natural logarithm of the number of samples. The first peak of the autocorrelation function curve of time series data is the sequence length.
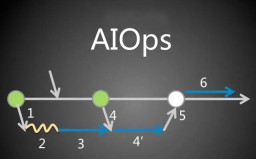
Select the sequence before and after the event and the randomly selected time series to calculate the correlation. The results are Dr and Df. If Dr is True and Df is False, it means that E occurs before S occurs (E -> S). If Dr is False and Df is True, or Dr is True and Df is True, it means that S occurs before E occurs (S -> E). As shown in the example below, the event CPU Intensive Program -> time series data CPU Usage, the time series data CPU Usage -> event SQL Query Alert.
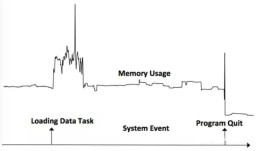
Monotonicity is judged by the changes in the time series before and after the event occurs. If the time series after the event occurs is larger than the value of the previous sequence, the monotonicity is increased, otherwise it is decreased. As shown in the figure below, the event loading Data Task caused an increase in Memory Usage, and the event Program Quit caused a decrease in Memory Usage.
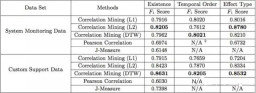
The article verifies the algorithm performance by using Microsoft's system monitoring data and data from the customer service team. The data are 24 S (memory, CPU and DISK data) and 52 E (execution of specific tasks), 7 S (HTTP status code) and 57 E (service subject), the evaluation standard is F-score. The results show that the DTW distance performs better overall than other distances (L1 and L2), and the algorithm overall performs better than the two baseline algorithms (Pearson correlation and J-Measure).
The article introduces a new unsupervised method to study the relationship between events and time series data, answering three questions: Are E and S related? What order did E and S occur? And what is a monotonic relationship? Compared with many current correlation studies, which mainly focus on the correlation between events and the correlation between time series data, this article focuses on the relationship between events and time series data. It is the first to answer the above three questions between events and time series data. problem work.
Event diagnosis has always been a very important task in the field of operation and maintenance. The correlation between events and time series data can not only provide good inspiration for event diagnosis, but also provide good clues for root cause analysis. The author verified the algorithm on Microsoft's internal data set and achieved good results, which is of high value to both academic and industrial circles.
The above is the detailed content of The details of Microsoft's AIOps work revealed. For more information, please follow other related articles on the PHP Chinese website!

 What are the main tasks of a Linux system administrator?Apr 19, 2025 am 12:23 AM
The main tasks of Linux system administrators include system monitoring and performance tuning, user management, software package management, security management and backup, troubleshooting and resolution, performance optimization and best practices. 1. Use top, htop and other tools to monitor system performance and tune it. 2. Manage user accounts and permissions through useradd commands and other commands. 3. Use apt and yum to manage software packages to ensure system updates and security. 4. Configure a firewall, monitor logs, and perform data backup to ensure system security. 5. Troubleshoot and resolve through log analysis and tool use. 6. Optimize kernel parameters and application configuration, and follow best practices to improve system performance and stability.
 Is it hard to learn Linux?Apr 18, 2025 am 12:23 AM
Learning Linux is not difficult. 1.Linux is an open source operating system based on Unix and is widely used in servers, embedded systems and personal computers. 2. Understanding file system and permission management is the key. The file system is hierarchical, and permissions include reading, writing and execution. 3. Package management systems such as apt and dnf make software management convenient. 4. Process management is implemented through ps and top commands. 5. Start learning from basic commands such as mkdir, cd, touch and nano, and then try advanced usage such as shell scripts and text processing. 6. Common errors such as permission problems can be solved through sudo and chmod. 7. Performance optimization suggestions include using htop to monitor resources, cleaning unnecessary files, and using sy
 What is the salary of Linux administrator?Apr 17, 2025 am 12:24 AM
The average annual salary of Linux administrators is $75,000 to $95,000 in the United States and €40,000 to €60,000 in Europe. To increase salary, you can: 1. Continuously learn new technologies, such as cloud computing and container technology; 2. Accumulate project experience and establish Portfolio; 3. Establish a professional network and expand your network.
 What is the main purpose of Linux?Apr 16, 2025 am 12:19 AM
The main uses of Linux include: 1. Server operating system, 2. Embedded system, 3. Desktop operating system, 4. Development and testing environment. Linux excels in these areas, providing stability, security and efficient development tools.
 Does the internet run on Linux?Apr 14, 2025 am 12:03 AM
The Internet does not rely on a single operating system, but Linux plays an important role in it. Linux is widely used in servers and network devices and is popular for its stability, security and scalability.
 What are Linux operations?Apr 13, 2025 am 12:20 AM
The core of the Linux operating system is its command line interface, which can perform various operations through the command line. 1. File and directory operations use ls, cd, mkdir, rm and other commands to manage files and directories. 2. User and permission management ensures system security and resource allocation through useradd, passwd, chmod and other commands. 3. Process management uses ps, kill and other commands to monitor and control system processes. 4. Network operations include ping, ifconfig, ssh and other commands to configure and manage network connections. 5. System monitoring and maintenance use commands such as top, df, du to understand the system's operating status and resource usage.
 Boost Productivity with Custom Command Shortcuts Using Linux AliasesApr 12, 2025 am 11:43 AM
Introduction Linux is a powerful operating system favored by developers, system administrators, and power users due to its flexibility and efficiency. However, frequently using long and complex commands can be tedious and er
 What is Linux actually good for?Apr 12, 2025 am 12:20 AM
Linux is suitable for servers, development environments, and embedded systems. 1. As a server operating system, Linux is stable and efficient, and is often used to deploy high-concurrency applications. 2. As a development environment, Linux provides efficient command line tools and package management systems to improve development efficiency. 3. In embedded systems, Linux is lightweight and customizable, suitable for environments with limited resources.


Hot AI Tools

Undresser.AI Undress
AI-powered app for creating realistic nude photos

AI Clothes Remover
Online AI tool for removing clothes from photos.

Undress AI Tool
Undress images for free

Clothoff.io
AI clothes remover

AI Hentai Generator
Generate AI Hentai for free.

Hot Article
Hot Tools

ZendStudio 13.5.1 Mac
Powerful PHP integrated development environment

Notepad++7.3.1
Easy-to-use and free code editor

mPDF
mPDF is a PHP library that can generate PDF files from UTF-8 encoded HTML. The original author, Ian Back, wrote mPDF to output PDF files "on the fly" from his website and handle different languages. It is slower than original scripts like HTML2FPDF and produces larger files when using Unicode fonts, but supports CSS styles etc. and has a lot of enhancements. Supports almost all languages, including RTL (Arabic and Hebrew) and CJK (Chinese, Japanese and Korean). Supports nested block-level elements (such as P, DIV),

EditPlus Chinese cracked version
Small size, syntax highlighting, does not support code prompt function

Dreamweaver CS6
Visual web development tools

