


pandas data cleaning techniques revealed!
Introduction:
In data analysis and machine learning, data cleaning is a very important step, which involves preprocessing, transforming and filtering the data set in order to organize the data into The format and structure we need. Pandas is one of the most popular and powerful data analysis libraries in Python. It provides rich and flexible data cleaning tools and operation methods. This article will reveal some basic techniques of pandas data cleaning and provide specific code examples to help readers better understand and apply these techniques.
1. Import the pandas library and data set
Before starting, you first need to install the pandas library. After the installation is complete, you can use the following code to import the pandas library and load the data set that needs to be cleaned.
import pandas as pd

# 导入数据集
data = pd.read_csv('data.csv')
2. View the data set
Before performing data cleaning, you first need to understand the structure and content of the data set. pandas provides several commonly used functions to view data sets, including head(), tail(), shape and info()wait.
Code example:
# 查看前五行数据
print(data.head())

# 查看后五行数据
print(data.tail())

# 查看数据集的维度
print(data.shape)

# 查看数据集的基本信息
print(data.info())
3. Handling missing values
Missing values are one of the problems often encountered in data sets, and they are very common in real data sets. Pandas provides several ways to handle missing values. Common methods for dealing with missing values include deletion, filling, and interpolation.
- Delete missing values
Deleting missing values is one of the simplest processing methods, but it needs to be used with caution. In pandas, you can use the dropna() function to delete rows or columns containing missing values.
Code example:
# 删除包含缺失值的行
data.dropna(axis=0, inplace=True)

# 删除包含缺失值的列
data.dropna(axis=1, inplace=True)
- Filling missing values
Filling missing values is another common processing method, which can use a constant or other values in the dataset to fill in missing values. In pandas, you can use the fillna() function to fill in missing values.
Code example:
# 使用0填充缺失值
data.fillna(0, inplace=True)

# 使用平均值填充缺失值
data.fillna(data.mean(), inplace=True)
- Interpolating missing values
Interpolating missing values is a more advanced processing method that can be based on known data. Features to impute missing values. In pandas, you can use the interpolate() function to perform interpolation processing.
Code example:
# 线性插值处理缺失值
data.interpolate(method='linear', inplace=True)

# 拟合插值处理缺失值
data.interpolate(method='quadratic', inplace=True)
4. Handling duplicate values
Duplicate values are another common data set problem, which may lead to deviations in data analysis and modeling. pandas provides several functions to handle duplicate values, including duplicated() and drop_duplicates(), etc.
- Find duplicate values
You can use the duplicated() function to find duplicate values in the data set. This function returns a Boolean Series object that contains information about whether each element is repeated.
Code example:
# 查找重复值
duplicated_data = data.duplicated()

# 打印重复值
print(duplicated_data)
- Delete duplicate values
You can use the drop_duplicates() function to delete duplicate values in the data set . This function returns a new deduplicated data set.
Code example:
# 删除重复值
data.drop_duplicates(inplace=True)
5. Handling outliers
Outliers are abnormal observation values in the data set, which may have adverse effects on data distribution and model fitting. . Pandas provides some functions and methods to identify and deal with outliers, including boxplots, z-score, IQR, etc.
- Box plot
The box plot is a commonly used outlier detection method, which can be used to determine whether there are outliers in the data set. You can use the boxplot() function to draw a boxplot and identify outliers by observing outliers in the boxplot.
Code example:
# 绘制箱线图
data.boxplot(column='value', figsize=(10, 6))

# 显示图像
plt.show()
- z-score
z-score is a statistical concept that can be used to standardize data and judge observation values deviates from the average. In pandas, you can use the zscore() function to calculate z-score and determine whether there are outliers by setting a threshold.
Code example:
# 计算z-score
z_scores = (data - data.mean()) / data.std()

# 判断是否存在异常值
outliers = z_scores[(z_scores > 3) | (z_scores < -3)]

# 显示异常值
print(outliers)
- IQR
IQR (Inter-Quartile Range) is a calculation concept that can be calculated by calculating the four-dimensional range of a data set. Quantile difference to determine the range of outliers. In pandas, you can use the quantile() function to calculate quartiles, and then use the IQR formula to determine whether there are outliers.
Code example:
# 计算四分位差
Q1 = data.quantile(0.25)
Q3 = data.quantile(0.75)
IQR = Q3 - Q1

# 判断是否存在异常值
outliers = data[((data < (Q1 - 1.5 * IQR)) | (data > (Q3 + 1.5 * IQR))).any(axis=1)]

# 显示异常值
print(outliers)
6. Convert data type
The data type is an important attribute in the data set, which involves the storage method, calculation method and visualization method of the data. wait. In pandas, you can use the astype() function to convert data types.
Code example:
# 将字符串类型转换为整数类型
data['column'] = data['column'].astype(int)

# 将浮点型转换为整数类型
data['column'] = data['column'].astype(int)

# 将字符串类型转换为日期类型
data['column'] = pd.to_datetime(data['column'])
7. Other common operations
In addition to the above data cleaning techniques, pandas also provides some other commonly used data cleaning operations, including renaming columns, split columns, merge columns, etc.
- Rename columns
You can use the rename() function to rename columns in the data set.
Code example:
# 重命名列
data.rename(columns={'old_name': 'new_name'}, inplace=True)- Split columns
You can use the str.split() function to split columns containing multiple The column of values is split into multiple columns.
Code example:
# 拆分列
new_columns = data['column'].str.split(',', expand=True)

# 重新命名新列
new_columns.columns = ['column1', 'column2', 'column3']

# 合并新列到数据集
data = pd.concat([data, new_columns], axis=1)- Merge columns
You can use the pd.merge() function to merge multiple columns in the data set columns.
Code example:
# 新数据集1
data1 = pd.DataFrame({'key': ['A', 'B', 'C'], 'value1': [1, 2, 3]})

# 新数据集2
data2 = pd.DataFrame({'key': ['A', 'B', 'C'], 'value2': [4, 5, 6]})

# 合并数据集
merged_data = pd.merge(data1, data2, on='key')

# 打印合并后的数据集
print(merged_data)
Summary:
This article introduces some commonly used pandas data cleaning techniques and provides specific code examples. These techniques include handling missing values, handling duplicate values, handling outliers, converting data types, and other common operations. By learning and applying these techniques, readers can better process and prepare data, laying a solid foundation for subsequent data analysis and modeling. Of course, in addition to the techniques introduced in this article, pandas has many other functions and methods, and readers can further learn and apply them according to their own needs and actual situations.
The above is the detailed content of Reveal important tips for pandas data cleaning!. For more information, please follow other related articles on the PHP Chinese website!

 python pandas安装方法Nov 22, 2023 pm 02:33 PM
python可以通过使用pip、使用conda、从源代码、使用IDE集成的包管理工具来安装pandas。详细介绍:1、使用pip,在终端或命令提示符中运行pip install pandas命令即可安装pandas;2、使用conda,在终端或命令提示符中运行conda install pandas命令即可安装pandas;3、从源代码安装等等。
 日常工作中,Python+Pandas是否能代替Excel+VBA?May 04, 2023 am 11:37 AM
知乎上有个热门提问,日常工作中Python+Pandas是否能代替Excel+VBA?我的建议是,两者是互补关系,不存在谁替代谁。复杂数据分析挖掘用Python+Pandas,日常简单数据处理用Excel+VBA。从数据处理分析能力来看,Python+Pandas肯定是能取代Excel+VBA的,而且要远远比后者强大。但从便利性、传播性、市场认可度来看,Excel+VBA在职场工作上还是无法取代的。因为Excel符合绝大多数人的使用习惯,使用成本更低。就像Photoshop能修出更专业的照片,为
 如何使用Python中的Pandas按特定列合并两个CSV文件?Sep 08, 2023 pm 02:01 PM
CSV(逗号分隔值)文件广泛用于以简单格式存储和交换数据。在许多数据处理任务中,需要基于特定列合并两个或多个CSV文件。幸运的是,这可以使用Python中的Pandas库轻松实现。在本文中,我们将学习如何使用Python中的Pandas按特定列合并两个CSV文件。什么是Pandas库?Pandas是一个用于Python信息控制和检查的开源库。它提供了用于处理结构化数据(例如表格、时间序列和多维数据)以及高性能数据结构的工具。Pandas广泛应用于金融、数据科学、机器学习和其他需要数据操作的领域。
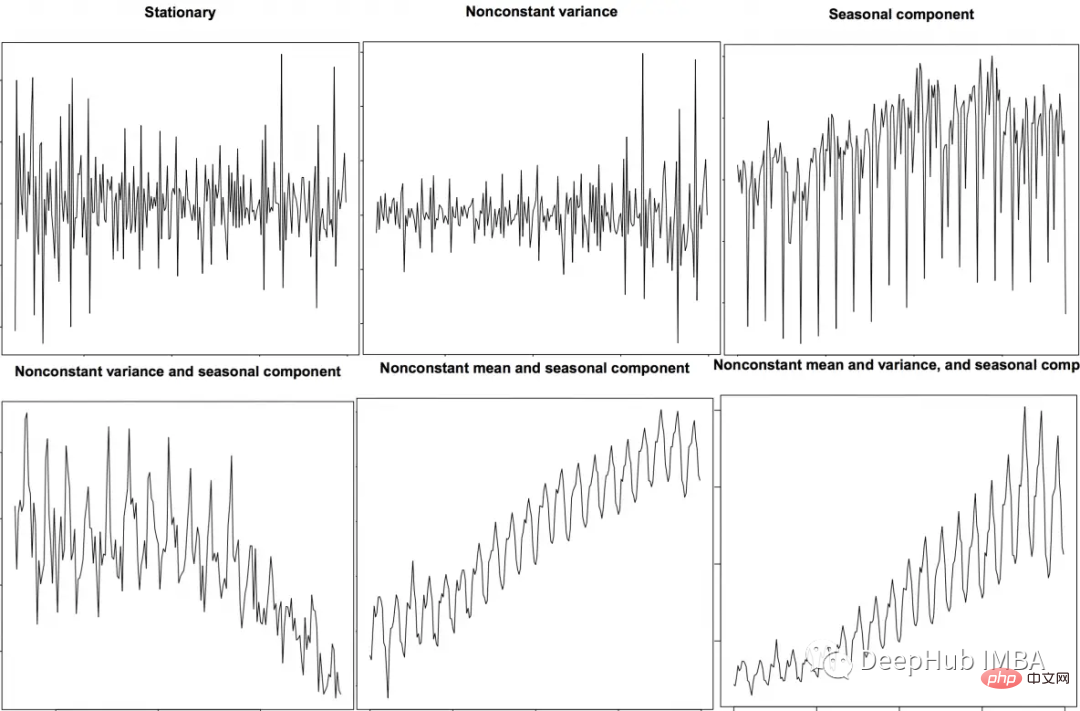 时间序列特征提取的Python和Pandas代码示例Apr 12, 2023 pm 05:43 PM
使用Pandas和Python从时间序列数据中提取有意义的特征,包括移动平均,自相关和傅里叶变换。前言时间序列分析是理解和预测各个行业(如金融、经济、医疗保健等)趋势的强大工具。特征提取是这一过程中的关键步骤,它涉及将原始数据转换为有意义的特征,可用于训练模型进行预测和分析。在本文中,我们将探索使用Python和Pandas的时间序列特征提取技术。在深入研究特征提取之前,让我们简要回顾一下时间序列数据。时间序列数据是按时间顺序索引的数据点序列。时间序列数据的例子包括股票价格、温度测量和交通数据。
 pandas写入excel有哪些方法Nov 22, 2023 am 11:46 AM
pandas写入excel的方法有:1、安装所需的库;2、读取数据集;3、写入Excel文件;4、指定工作表名称;5、格式化输出;6、自定义样式。Pandas是一个流行的Python数据分析库,提供了许多强大的数据清洗和分析功能,要将Pandas数据写入Excel文件,可以使用Pandas提供的“to_excel()”方法。
 pandas如何读取txt文件Nov 21, 2023 pm 03:54 PM
pandas读取txt文件的步骤:1、安装Pandas库;2、使用“read_csv”函数读取txt文件,并指定文件路径和文件分隔符;3、Pandas将数据读取为一个名为DataFrame的对象;4、如果第一行包含列名,则可以通过将header参数设置为0来指定,如果没有,则设置为None;5、如果txt文件中包含缺失值或空值,可以使用“na_values”指定这些缺失值。
 pandas怎么读取csv文件Dec 01, 2023 pm 04:18 PM
读取CSV文件的方法有使用read_csv()函数、指定分隔符、指定列名、跳过行、缺失值处理、自定义数据类型等。详细介绍:1、read_csv()函数是Pandas中最常用的读取CSV文件的方法。它可以从本地文件系统或远程URL加载CSV数据,并返回一个DataFrame对象;2、指定分隔符,默认情况下,read_csv()函数将使用逗号作为CSV文件的分隔符等等。
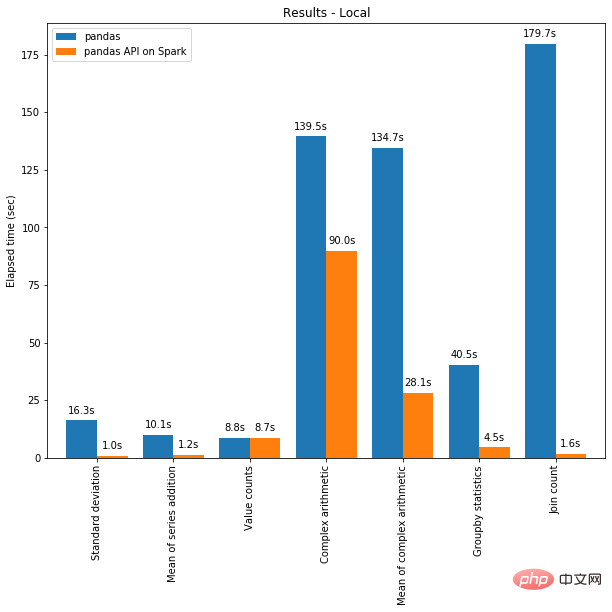 Pandas 与 PySpark 强强联手,功能与速度齐飞!May 01, 2023 pm 09:19 PM
使用Python做数据处理的数据科学家或数据从业者,对数据科学包pandas并不陌生,也不乏像云朵君一样的pandas重度使用者,项目开始写的第一行代码,大多是importpandasaspd。pandas做数据处理可以说是yyds!而他的缺点也是非常明显,pandas只能单机处理,它不能随数据量线性伸缩。例如,如果pandas试图读取的数据集大于一台机器的可用内存,则会因内存不足而失败。另外pandas在处理大型数据方面非常慢,虽然有像Dask或Vaex等其他库来优化提升数


Hot AI Tools

Undresser.AI Undress
AI-powered app for creating realistic nude photos

AI Clothes Remover
Online AI tool for removing clothes from photos.

Undress AI Tool
Undress images for free

Clothoff.io
AI clothes remover

AI Hentai Generator
Generate AI Hentai for free.

Hot Article
Hot Tools

SublimeText3 Chinese version
Chinese version, very easy to use

Dreamweaver Mac version
Visual web development tools

WebStorm Mac version
Useful JavaScript development tools

Notepad++7.3.1
Easy-to-use and free code editor

SecLists
SecLists is the ultimate security tester's companion. It is a collection of various types of lists that are frequently used during security assessments, all in one place. SecLists helps make security testing more efficient and productive by conveniently providing all the lists a security tester might need. List types include usernames, passwords, URLs, fuzzing payloads, sensitive data patterns, web shells, and more. The tester can simply pull this repository onto a new test machine and he will have access to every type of list he needs.

