

 Technology peripheralsAIImplement a simple linear regression method in R and explain its concepts
Simple linear regression is a statistical method used to study the relationship between two continuous variables. Among them, one variable is called the independent variable (x) and the other variable is called the dependent variable (y). We assume that there is a linear relationship between these two variables and try to find a linear function that accurately predicts the response value (y) of the dependent variable based on the characteristics of the independent variable. By fitting a straight line, we can get the predicted results. This predictive model can be used to understand and predict how the dependent variable changes as the independent variables change.
In order to understand this concept, we can use a salary data set, which contains the value of the dependent variable (salary) corresponding to each independent variable (years of experience).
Salary Data Set
Annual Salary and Experience
1.1 39343.00
1.3 46205.00
1.5 37731.00
2.0 43525.00
2.2 39891.00
2.9 56642.00
3.0 60150.00
3.2 54445.00
3.2 64445.00
3.7 57189.00
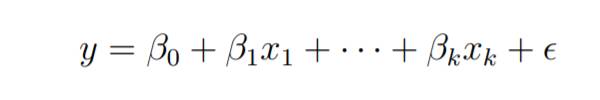
For general purposes, we define:
x as the feature vector, that is, x=[x_1,x_2,....,x_n],
y as the response vector, That is, y=[y_1,y_2,....,y_n]
for n observations (in the above example, n=10).
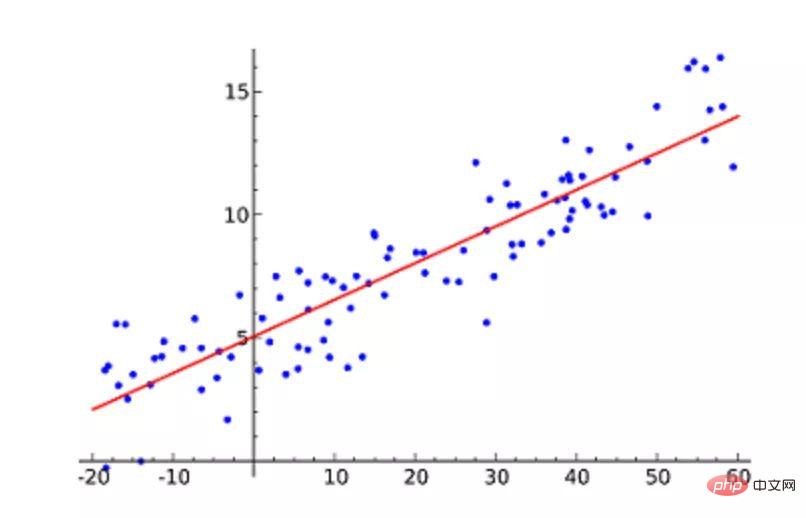
Scatterplot of the given data set

Now, we have to find a line that fits the above scatterplot by It allows us to predict the response for any y value or any x value.
The line of best fit is called the regression line.
The following R code is used to implement simple linear regression
dataset=read.csv('salary.csv')
install.packages('caTools')
library(caTools)
split=sample.split(dataset$Salary,SplitRatio=0.7)
trainingset=subset(dataset,split==TRUE)
testset=subset(dataset,split==FALSE)
lm.r=lm(formula=Salary~YearsExperience,
data=trainingset)
coef(lm.r)
ypred=predict(lm.r,newdata=testset)
install.packages("ggplot2")
library(ggplot2)
ggplot()+geom_point(aes(x=trainingset$YearsExperience,
y=trainingset$Salary),colour='red')+
geom_line(aes(x=trainingset$YearsExperience,
y=predict(lm.r,newdata=trainingset)),colour='blue')+
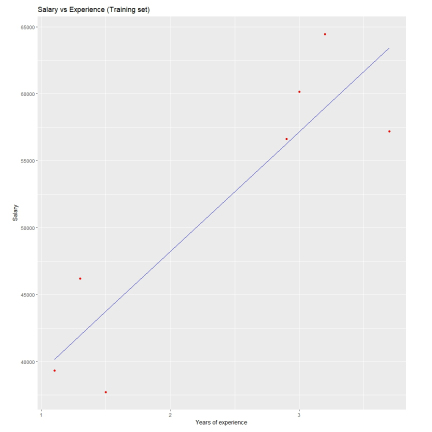
ggtitle('Salary vs Experience(Training set)')+
xlab('Years of experience')+
ylab('Salary')
ggplot()+
geom_point(aes(x=testset$YearsExperience,y=testset$Salary),
colour='red')+
geom_line(aes(x=trainingset$YearsExperience,
y=predict(lm.r,newdata=trainingset)),
colour='blue')+
ggtitle('Salary vs Experience(Test set)')+
xlab('Years of experience')+
ylab('Salary')Visualize the training set results
The above is the detailed content of Implement a simple linear regression method in R and explain its concepts. For more information, please follow other related articles on the PHP Chinese website!

 深入解析多元线性回归模型的概念与应用Jan 22, 2024 pm 06:30 PM
多元线性回归是最常见的线性回归形式,用于描述单个响应变量Y如何与多个预测变量呈现线性关系。可以使用多重回归的应用示例:房子的售价可能受到位置、卧室和浴室数量、建造年份、地块面积等因素的影响。2、孩子的身高取决于母亲的身高、父亲的身高、营养和环境因素。多元线性回归模型参数考虑一个具有k个独立预测变量x1、x2……、xk和一个响应变量y的多元线性回归模型。假设我们对k+1个变量有n个观测值,并且n的变量应该大于k。最小二乘回归的基本目标是将超平面拟合到(k+1)维空间中,以最小化残差平方和。在对模型
 Python中的线性回归模型详解Jun 10, 2023 pm 12:28 PM
Python中的线性回归模型详解线性回归是一种经典的统计模型和机器学习算法。它被广泛应用于预测和建模的领域,如股票市场预测、天气预测、房价预测等。Python作为一种高效的编程语言,提供了丰富的机器学习库,其中就包括线性回归模型。本文将详细介绍Python中的线性回归模型,包括模型原理、应用场景和代码实现等。线性回归原理线性回归模型是建立在变量之间存在线性关
 吉洪诺夫正则化Jan 23, 2024 am 09:33 AM
吉洪诺夫正则化,又称为岭回归或L2正则化,是一种用于线性回归的正则化方法。它通过在模型的目标函数中添加一个L2范数惩罚项来控制模型的复杂度和泛化能力。该惩罚项对模型的权重进行平方和的惩罚,以避免权重过大,从而减轻过拟合问题。这种方法通过在损失函数中引入正则化项,通过调整正则化系数来平衡模型的拟合能力和泛化能力。吉洪诺夫正则化在实际应用中具有广泛的应用,可以有效地改善模型的性能和稳定性。在正则化之前,线性回归的目标函数可以表示为:J(w)=\frac{1}{2m}\sum_{i=1}^{m}(h_
 机器学习必知必会十大算法!Apr 12, 2023 am 09:34 AM
1.线性回归线性回归(Linear Regression)可能是最流行的机器学习算法。线性回归就是要找一条直线,并且让这条直线尽可能地拟合散点图中的数据点。它试图通过将直线方程与该数据拟合来表示自变量(x 值)和数值结果(y 值)。然后就可以用这条线来预测未来的值!这种算法最常用的技术是最小二乘法(Least of squares)。这个方法计算出最佳拟合线,以使得与直线上每个数据点的垂直距离最小。总距离是所有数据点的垂直距离(绿线)的平方和。其思想是通过最小化这个平方误差或距离来拟合模型。例如
 线性与非线性分析的多项式回归性质Jan 22, 2024 pm 03:03 PM
多项式回归是一种适用于非线性数据关系的回归分析方法。与简单线性回归模型只能拟合直线关系不同,多项式回归模型可以更准确地拟合复杂的曲线关系。它通过引入多项式特征,将变量的高阶项加入模型,从而更好地适应数据的非线性变化。这种方法可以提高模型的灵活性和拟合度,从而更准确地预测和解释数据。多项式回归模型的基本形式为:y=β0+β1x+β2x^2+…+βn*x^n+ε在这个模型中,y是我们要预测的因变量,x是自变量。β0~βn是模型的系数,它们决定了自变量对因变量的影响程度。ε表示模型的误差项,它是由无法
 广义线性模型和普通线性模型的区别Jan 23, 2024 pm 01:45 PM
广义线性模型和一般线性模型是统计学中常用的回归分析方法。尽管这两个术语相似,但它们在某些方面有区别。广义线性模型允许因变量服从非正态分布,通过链接函数将预测变量与因变量联系起来。而一般线性模型假设因变量服从正态分布,使用线性关系进行建模。因此,广义线性模型更加灵活,适用范围更广。1.定义和范围一般线性模型是一种回归分析方法,适用于因变量与自变量之间存在线性关系的情况。它假设因变量服从正态分布。广义线性模型是一种适用于因变量不一定服从正态分布的回归分析方法。它通过引入链接函数和分布族,能够描述因变
 Logistic回归中OR值的定义、意义和计算详解Jan 23, 2024 pm 12:48 PM
Logistic回归是一种用于分类问题的线性模型,主要用于预测二分类问题中的概率值。它通过使用sigmoid函数将线性预测值转换为概率值,并根据阈值进行分类决策。在Logistic回归中,OR值是一个重要的指标,用于衡量模型中不同变量对结果的影响程度。OR值代表了自变量的单位变化对因变量发生的概率的倍数变化。通过计算OR值,我们可以判断某个变量对模型的贡献程度。OR值的计算方法是取指数函数(exp)的自然对数(ln)的系数,即OR=exp(β),其中β是Logistic回归模型中自变量的系数。具
 使用正规方程实施线性回归的方法和前提条件Jan 23, 2024 pm 12:15 PM
正规方程是一种用于线性回归的简单而直观的方法。通过数学公式直接计算出最佳拟合直线,而不需要使用迭代算法。这种方法特别适用于小型数据集。首先,我们来回顾一下线性回归的基本原理。线性回归是一种用于预测因变量Y与一个或多个自变量X之间关系的方法。简单线性回归中只有一个自变量X,而多元线性回归中则包含两个或更多个自变量。在线性回归中,我们使用最小二乘法拟合直线,使数据点到直线的距离和最小。直线方程为:Y=β0+β1X1+β2X2+…+βnXn方程的目标是找到最佳的截距和回归系数,以使其能够最好地拟合数据


Hot AI Tools

Undresser.AI Undress
AI-powered app for creating realistic nude photos

AI Clothes Remover
Online AI tool for removing clothes from photos.

Undress AI Tool
Undress images for free

Clothoff.io
AI clothes remover

AI Hentai Generator
Generate AI Hentai for free.

Hot Article
Hot Tools

SAP NetWeaver Server Adapter for Eclipse
Integrate Eclipse with SAP NetWeaver application server.

MinGW - Minimalist GNU for Windows
This project is in the process of being migrated to osdn.net/projects/mingw, you can continue to follow us there. MinGW: A native Windows port of the GNU Compiler Collection (GCC), freely distributable import libraries and header files for building native Windows applications; includes extensions to the MSVC runtime to support C99 functionality. All MinGW software can run on 64-bit Windows platforms.

VSCode Windows 64-bit Download
A free and powerful IDE editor launched by Microsoft

MantisBT
Mantis is an easy-to-deploy web-based defect tracking tool designed to aid in product defect tracking. It requires PHP, MySQL and a web server. Check out our demo and hosting services.

mPDF
mPDF is a PHP library that can generate PDF files from UTF-8 encoded HTML. The original author, Ian Back, wrote mPDF to output PDF files "on the fly" from his website and handle different languages. It is slower than original scripts like HTML2FPDF and produces larger files when using Unicode fonts, but supports CSS styles etc. and has a lot of enhancements. Supports almost all languages, including RTL (Arabic and Hebrew) and CJK (Chinese, Japanese and Korean). Supports nested block-level elements (such as P, DIV),

