 Backend Development
 Python Tutorial
 Solving practical problems: A practical guide to Matplotlib line charts
Practical Guide: Use matplotlib to draw line charts to solve practical problems
Introduction
Data visualization plays an important role in solving practical problems. The line chart is the most commonly used and common chart type. In this article, we will introduce how to use Python's matplotlib library to draw a line chart, and solve practical problems through specific code examples.
1. Preparation
Before we start, we need to install the matplotlib library. Open a terminal or command prompt and enter the following command to install the latest version of the matplotlib library:
pip install matplotlib
After the installation is complete, we can start using matplotlib to draw line charts.
2. Basic Line Chart
Line charts are often used to show data trends that change with time, space or other variables. Below is a simple example showing the average monthly temperature for a city.
import matplotlib.pyplot as plt

# X轴数据,代表月份
months = ['Jan', 'Feb', 'Mar', 'Apr', 'May', 'Jun']
# Y轴数据,代表平均气温
avg_temperatures = [10, 12, 15, 18, 22, 25]

# 绘制折线图
plt.plot(months, avg_temperatures)

# 设置图表标题和轴标签
plt.title("Average temperatures in a city")
plt.xlabel("Months")
plt.ylabel("Temperature (°C)")

# 显示图表
plt.show()
The above code first imports the matplotlib library, and then creates two list variables months and avg_temperatures, which store the month and average temperature data respectively.
Next, call the plt.plot() function to draw a line chart. In this function, the first parameter passed in is the X-axis data, and the second parameter is the Y-axis data.
Next, set the title and axis label of the chart through the plt.title(), plt.xlabel() and plt.ylabel() functions.
Finally, call the plt.show() function to display the chart.
Run the above code and you will get a simple line chart showing the average temperature for each month.
3. Add styles to line charts
In practical applications, we usually need to add styles to line charts to make them more beautiful and readable.
For example, we can add the color, thickness and line style of the line. Modify the above code as follows:
# 绘制折线图,并设置线条的颜色为红色,线宽为2,线型为虚线
plt.plot(months, avg_temperatures, color='red', linewidth=2, linestyle='--')
Set the color, thickness and line style of the line by passing in the color, linewidth and linestyle parameters.
In addition, we can also add marker points to the line chart to highlight the location of the data points. Modify the above code as follows:
# 绘制折线图,并标记数据点,标记点的形状为圆形,颜色为蓝色
plt.plot(months, avg_temperatures, marker='o', markersize=8, color='blue')
Set the shape, size and color of the marker point by passing in the marker, markersize and color parameters.
4. Solve practical problems
Line charts can be used to solve various practical problems. Below is an example showing a company's sales over the past year.
import matplotlib.pyplot as plt

# X轴数据,代表月份
months = ['Jan', 'Feb', 'Mar', 'Apr', 'May', 'Jun', 'Jul', 'Aug', 'Sep', 'Oct', 'Nov', 'Dec']
# Y轴数据,代表销售额(单位:万元)
sales = [10, 12, 15, 18, 22, 25, 28, 30, 35, 40, 45, 50]

# 绘制折线图
plt.plot(months, sales)

# 设置图表标题和轴标签
plt.title("Sales in a company")
plt.xlabel("Months")
plt.ylabel("Sales (in 10,000 RMB)")

# 显示图表
plt.show()
The above code shows the sales of a certain company in the past year. The X-axis represents the month and the Y-axis represents the sales (unit: 10,000 yuan).
By running the above code, you will get a line chart showing the changes in sales over time.
Conclusion
This article introduces how to use the matplotlib library to draw a line chart, and how to improve the readability and beauty of the chart by adding styles and solving practical problems. Line charts are widely used in data visualization and can help us better understand and analyze data.
In practical applications, we can flexibly adjust the style of the line chart according to different needs and data characteristics to achieve the best data display effect. At the same time, we can also use other functions provided by the matplotlib library, such as adding legends, setting coordinate axis ranges, etc., to further enrich the chart content.
I hope this article will be helpful to you when using the matplotlib library to draw line charts. I also hope that you can further learn and explore other techniques and methods of data visualization to better apply it to practical problem solving.
The above is the detailed content of Solving practical problems: A practical guide to Matplotlib line charts. For more information, please follow other related articles on the PHP Chinese website!
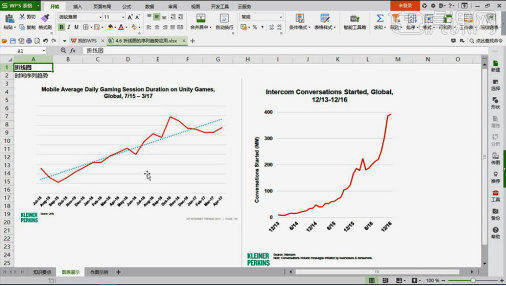
 WPS表格折线图怎么做你真的会吗Mar 21, 2024 am 08:36 AM
使用wps表格进行大量的数据处理可以使我们的工作更加有效率,当然,wps表格不光能处理数据,还可以根据数据制定折线图图表等数据,这样查看时更佳直观。可对于有些新手来说,不知道wps表格折线图怎么做,今天我就跟大家讲解下制作折线图的详细步骤:1、首先查看【折线图的使用场景】。2、制作方法:首先选择【数据源-插入图表-折线图】点击【图表元素-勾选趋势线-图表中会相应的出现一道虚线】。3、然后在【数据源中插入一列为平均值】使用【AVERAGE进行求平均值】下拉填充的方法【先复制粘贴值-然后在下拉填充】
 Vue统计图表的柱状和折线图功能实现Aug 17, 2023 am 11:39 AM
Vue统计图表的柱状和折线图功能实现引言:在数据可视化的应用中,统计图表是一种常用的展示数据的方式。而Vue作为一种流行的JavaScript框架,提供了丰富的功能和易用性,非常适合用于实现统计图表。本文将介绍使用Vue实现柱状图和折线图的具体步骤,并附上代码示例。一、柱状图实现柱状图是一种以矩形的高度来表示数据大小的图表。下面是使用Vue和echarts库
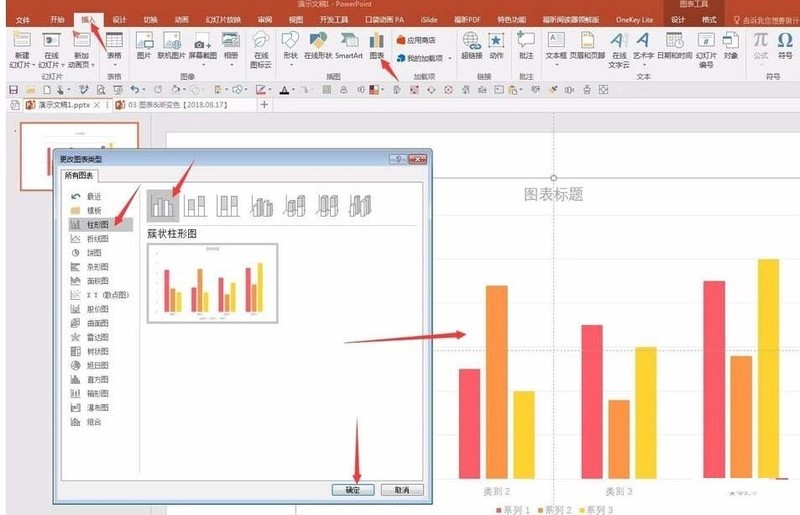
 PPT制作折线和柱形混合图表的步骤Mar 26, 2024 pm 09:26 PM
1、在PPT中插入数据图,类型选择【簇状柱形图】。2、输入源数据,只使用两列数据,比如,第一列为月数据,第二列为月累计数据。3、更改累计数据系列的图表类型,点击图表工具下的"更改图表类型,点击【组合】,累计数据选择带数据标记的折线图,并勾选次坐标轴。4、点击确定后,得到了基本的组合图形。5、添加柱形图和折线图的数据标签。并设置不同颜色以示区别。6、对数据图做进一步美化,删除不必要的元素,凸显信息,得到最终图表。
 如何在ECharts中使用折线图展示数据趋势Dec 17, 2023 am 11:12 AM
如何在ECharts中使用折线图展示数据趋势ECharts是一款基于JavaScript的开源可视化库,被广泛应用于各类数据分析和可视化展示项目中。它提供了丰富的图表类型和交互功能,使得数据的呈现更加直观和易于理解。本文将详细介绍如何使用ECharts中的折线图展示数据趋势,并提供具体的代码示例。一、准备工作在开始使用ECharts绘制折线图之前,我们需要做
 入门教程:学习使用matplotlib绘制折线图Jan 17, 2024 am 10:36 AM
简易教程:学会使用Matplotlib绘制折线图引言:Matplotlib是Python中常用的绘图库之一,可以用于绘制各种类型的图形,包括折线图。折线图是一种常用的数据可视化方式,能够清晰展示数据的变化趋势。本文将通过具体的代码示例,介绍如何使用Matplotlib绘制折线图。一、安装Matplotlib库:在使用Matplotlib之前,首先需要安装它。
 Vue 中如何实现折线图、曲线图等数据可视化技巧Jun 25, 2023 am 11:34 AM
Vue是一款流行的JavaScript框架,它被广泛应用于构建现代Web应用程序。数据可视化是Web应用程序中必不可少的技术之一,而折线图和曲线图则是常见的数据可视化技巧之一。在这篇文章中,我将介绍如何使用Vue来实现折线图和曲线图。1.使用第三方图表库Vue有很多第三方图表库可以使用,这些图表库提供了丰富的图表类型和配置选项,使得实现折线图和曲线图变得十分
 深入学习matplotlib:挖掘绘制折线图的高级功能和实际应用Jan 17, 2024 am 08:16 AM
进阶教程:探索matplotlib绘制折线图的更多功能和应用折线图是数据可视化中常用的一种图表类型,它可以清晰地展示数据的变化趋势和关系。而matplotlib是Python中最常用的数据可视化库之一,功能强大且易于使用。本文将介绍如何使用matplotlib绘制折线图,并进一步探索其更多的功能和应用。介绍matplotlib的基本用法要开始绘制折线图,首先
 怎么用excel做折线图-用excel做折线图的方法Mar 04, 2024 pm 01:25 PM
很多小伙伴不知道怎么用excel做折线图,所以下面小编就分享了用excel做折线图的方法,一起去看看吧,相信对大家会有帮助。1、打开Excel数据表格(如下图所示)。2、将表格内容全选中,然后点击菜单栏插入-折线图(如下图所示)。3、选择一种你喜欢的折线图点击一下(如下图所示)。4、最后,在Excel表格里面就会自动生成一个数据一致的折线图(如下图所示)。上面就是小编为大家带来的怎么用excel做折线图的全部内容,希望对大家能够有所帮助哦。


Hot AI Tools

Undresser.AI Undress
AI-powered app for creating realistic nude photos

AI Clothes Remover
Online AI tool for removing clothes from photos.

Undress AI Tool
Undress images for free

Clothoff.io
AI clothes remover

AI Hentai Generator
Generate AI Hentai for free.

Hot Article

Hot Tools

SAP NetWeaver Server Adapter for Eclipse
Integrate Eclipse with SAP NetWeaver application server.

SublimeText3 Linux new version
SublimeText3 Linux latest version

MinGW - Minimalist GNU for Windows
This project is in the process of being migrated to osdn.net/projects/mingw, you can continue to follow us there. MinGW: A native Windows port of the GNU Compiler Collection (GCC), freely distributable import libraries and header files for building native Windows applications; includes extensions to the MSVC runtime to support C99 functionality. All MinGW software can run on 64-bit Windows platforms.

WebStorm Mac version
Useful JavaScript development tools

VSCode Windows 64-bit Download
A free and powerful IDE editor launched by Microsoft


