
 Backend DevelopmentPython TutorialLearn how to effectively use matplotlib plotting to increase your efficiency

Improve efficiency! Master matplotlib drawing skills and tricks
Introduction:
In the process of data analysis and visualization, matplotlib is an important tool. It provides rich drawing functions and flexible parameter settings, but sometimes we may encounter some difficulties when using matplotlib, resulting in low efficiency. This article will introduce some matplotlib drawing tips and tricks to help us visualize data more efficiently.
1. Optimize graphic display
For the visualization of large data sets, the drawn graphics may be crowded and difficult to observe. The following methods allow us to better display data.
1. Use subgraphs:
Using subgraphs can divide the graph into multiple small areas for display, and each area displays a type of data. You can use the plt.subplots() function to create subplots, and the plt.subplot() function to specify the position of the subplot.
fig, ax = plt.subplots(2, 2)
ax[0, 0].plot(data1)
ax[0, 1].scatter(data2)
ax[1, 0].hist(data3)
ax[1, 1].bar(data4)
plt.show()
2. Use legends:
When we display multiple types of data on one graph, using legends can express the relationship between the data more clearly. You can use the plt.legend() function to add a legend and specify the position and style.
plt.plot(data1, label='data1')
plt.plot(data2, label='data2')
plt.legend(loc='upper right')
plt.show()
3. Set titles and labels:
When drawing graphics, we can set titles and labels to help readers understand more clearly what the graphics represent. You can use the plt.title() function to set the title, and the plt.xlabel() and plt.ylabel() functions to set the x-axis and y-axis labels.
plt.plot(data)
plt.title('Data trend')
plt.xlabel('Time')
plt.ylabel('Value')
plt.show()
2. Use common graphics efficiently
matplotlib provides a variety of drawing functions, some of the most common graphics include line charts, scatter plots, bar charts, and pie charts. Here are tips and tricks for drawing these shapes.
1. Line chart:
Line chart can show the trend of data changes over time or other variables. You can use the plt.plot() function to draw a line chart, and use the linestyle parameter to set the line style.
plt.plot(data, linestyle='--')
plt.show()
2. Scatter plot:
Scatter plot can show the relationship between two variables. You can use the plt.scatter() function to draw a scatter plot, and use the color and size parameters to set the color and size of the points.
plt.scatter(x_data, y_data, color='blue', s=10)
plt.show()
3. Histogram:
Histogram can show the comparison between different categories. You can use the plt.bar() function to draw a histogram, and use the color parameter to set the color of the column.
plt.bar(categories, values, color=['red', 'blue', 'green'])
plt.show()
4. Pie chart:
A pie chart can show the proportion of different parts to the whole. You can use the plt.pie() function to draw a pie chart, and use the colors parameter to set the color of the sector.
plt.pie(sizes, labels=labels, colors=['red', 'blue', 'green'])
plt.show()
3. Use style sheets and custom colors
matplotlib provides a wealth of style sheets and color options, which can help us create more beautiful graphics. Here's how to use style sheets and custom colors.
1. Style sheet:
matplotlib provides a variety of style sheets, which can set the color, style, font and other attributes of graphics with one click. Style sheets can be selected using the plt.style.use() function.
plt.style.use('ggplot')2. Custom colors:
In addition to using preset colors, we can also customize colors. Colors can be set using RGB or hexadecimal color codes.
plt.plot(data, color='#FF0000')
Conclusion:
This article introduces some matplotlib drawing tips and tricks, hoping to help readers visualize data more efficiently. By optimizing graph display, efficiently using common graphs, and using style sheets and custom colors, we can create clearer and more beautiful graphs and improve the effectiveness of data analysis. I hope readers can make good use of these techniques and gain a better data visualization experience.
The above is the detailed content of Learn how to effectively use matplotlib plotting to increase your efficiency. For more information, please follow other related articles on the PHP Chinese website!

 提高 Python 代码可读性的五个基本技巧Apr 12, 2023 pm 08:58 PM
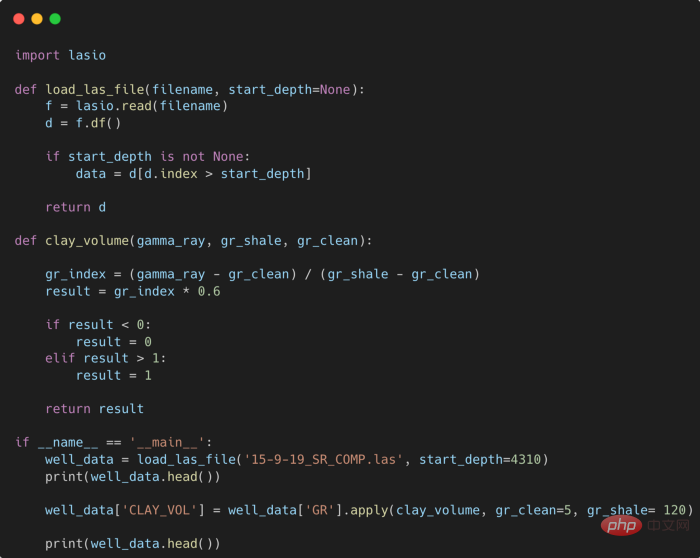
Python 中有许多方法可以帮助我们理解代码的内部工作原理,良好的编程习惯,可以使我们的工作事半功倍!例如,我们最终可能会得到看起来很像下图中的代码。虽然不是最糟糕的,但是,我们需要扩展一些事情,例如:load_las_file 函数中的 f 和 d 代表什么?为什么我们要在 clay 函数中检查结果?这些函数需要什么类型?Floats? DataFrames?在本文中,我们将着重讨论如何通过文档、提示输入和正确的变量名称来提高应用程序/脚本的可读性的五个基本技巧。1. Comments我们可
 使用PHP开发直播功能的十个技巧May 21, 2023 pm 11:40 PM
随着直播业务的火爆,越来越多的网站和应用开始加入直播这项功能。PHP作为一种流行的服务器端语言,也可以用来开发高效的直播功能。当然,要实现一个稳定、高效的直播功能需要考虑很多问题。下面列出了使用PHP开发直播功能的十个技巧,帮助你更好地实现直播。选择合适的流媒体服务器PHP开发直播功能,首先需要考虑的就是流媒体服务器的选择。有很多流媒体服务器可以选择,比如常
 PHP中的多表关联查询技巧May 24, 2023 am 10:01 AM
PHP中的多表关联查询技巧关联查询是数据库查询的重要部分,特别是当你需要展示多个相关数据库表内的数据时。在PHP应用程序中,在使用MySQL等数据库时,多表关联查询经常会用到。多表关联的含义是,将一个表中的数据与另一个或多个表中的数据进行比较,在结果中将那些满足要求的行连接起来。在进行多表关联查询时,需要考虑表之间的关系,并使用合适的关联方法。下面介绍几种多
 提高Python代码可读性的五个基本技巧Apr 11, 2023 pm 09:07 PM
译者 | 赵青窕审校 | 孙淑娟你是否经常回头看看6个月前写的代码,想知道这段代码底是怎么回事?或者从别人手上接手项目,并且不知道从哪里开始?这样的情况对开发者来说是比较常见的。Python中有许多方法可以帮助我们理解代码的内部工作方式,因此当您从头来看代码或者写代码时,应该会更容易地从停止的地方继续下去。在此我给大家举个例子,我们可能会得到如下图所示的代码。这还不是最糟糕的,但有一些事情需要我们去确认,例如:在load_las_file函数中f和d代表什么?为什么我们要在clay函数中检查结果
 PPT画图要如何操作Mar 20, 2024 pm 07:36 PM
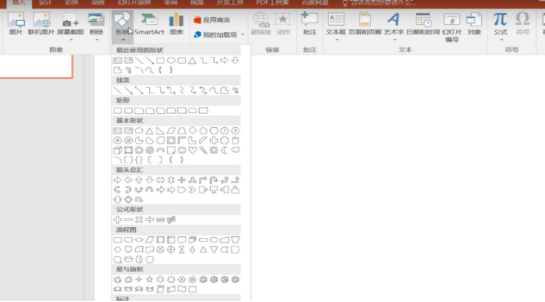
很多人对于PPT的理解是只能做幻灯片,文档表示不清楚就用PPT来展现,其实,PPT可以将图、视频都放进幻灯片里面,以便更好的参考、更直观地展现出我们想要表达的内容。PPT也可以做成一个思维导图放进里面供大家更好的理解,可以说PPT是把一件难以用口头表述的事情总起来,里面功能齐全,用法也很多。那么,相信大家肯定不知道PPT除了有这些如此齐全的功能与用法,还可以用来画图,那么PPT该如何画图呢?1.首先我们先打开PPT,点击【插入】,点击【形状】,选择喜欢的一个图形或者图案。2.图案选好之后,点击【
 Python中简单易用的并行加速技巧Apr 12, 2023 pm 02:25 PM
1.简介我们在日常使用Python进行各种数据计算处理任务时,若想要获得明显的计算加速效果,最简单明了的方式就是想办法将默认运行在单个进程上的任务,扩展到使用多进程或多线程的方式执行。而对于我们这些从事数据分析工作的人员而言,以最简单的方式实现等价的加速运算的效果尤为重要,从而避免将时间过多花费在编写程序上。而今天的文章费老师我就来带大家学习如何利用joblib这个非常简单易用的库中的相关功能,来快速实现并行计算加速效果。2.使用joblib进行并行计算作为一个被广泛使用的第三方Python库(
 四种Python推导式开发技巧,让你的代码更高效Apr 22, 2023 am 09:40 AM
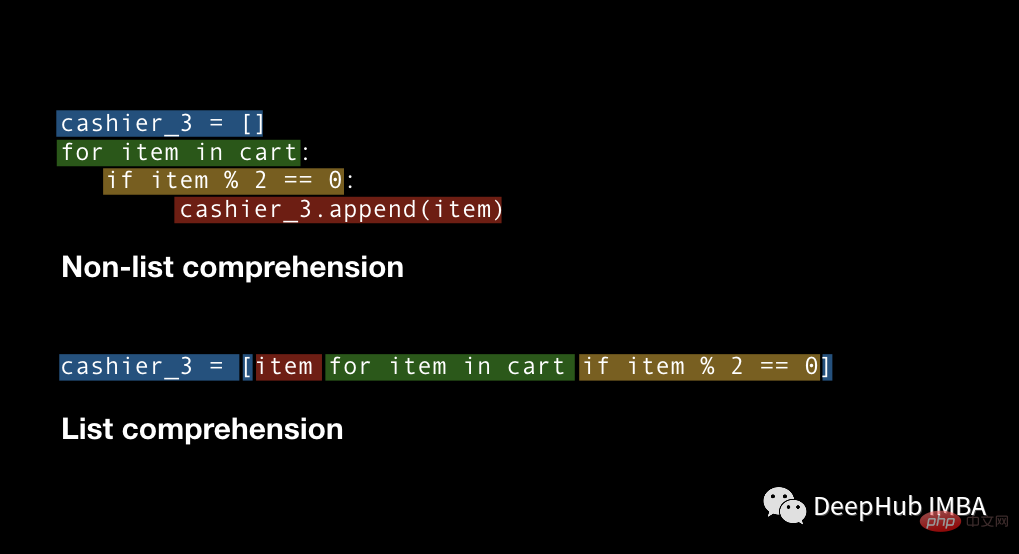
对于数据科学,Python通常被广泛地用于进行数据的处理和转换,它提供了强大的数据结构处理的函数,使数据处理更加灵活,这里说的“灵活性”是什么意思?这意味着在Python中总是有多种方法来实现相同的结果,我们总是有不同的方法并且需要从中选择易于使用、省时并能更好控制的方法。要掌握所有的这些方法是不可能的。所以这里列出了在处理任何类型的数据时应该知道的4个Python技巧。列表推导式ListComprehension是创建列表的一种优雅且最符合python语言的方法。与for循环和if语句相比,列
 学习如何有效使用matplotlib绘图来提高效率Jan 09, 2024 pm 05:54 PM
提高效率!掌握matplotlib画图技巧与窍门引言:在数据分析和可视化的过程中,matplotlib是一个重要的工具。它提供了丰富的绘图函数和灵活的参数设置,但有时候我们可能会在使用matplotlib时遇到一些困难,导致效率低下。本文将介绍一些matplotlib的画图技巧和窍门,帮助我们更加高效地进行数据可视化。一、优化图形显示对于大型数据集的可视化,


Hot AI Tools

Undresser.AI Undress
AI-powered app for creating realistic nude photos

AI Clothes Remover
Online AI tool for removing clothes from photos.

Undress AI Tool
Undress images for free

Clothoff.io
AI clothes remover

AI Hentai Generator
Generate AI Hentai for free.

Hot Article
Hot Tools

Dreamweaver Mac version
Visual web development tools

mPDF
mPDF is a PHP library that can generate PDF files from UTF-8 encoded HTML. The original author, Ian Back, wrote mPDF to output PDF files "on the fly" from his website and handle different languages. It is slower than original scripts like HTML2FPDF and produces larger files when using Unicode fonts, but supports CSS styles etc. and has a lot of enhancements. Supports almost all languages, including RTL (Arabic and Hebrew) and CJK (Chinese, Japanese and Korean). Supports nested block-level elements (such as P, DIV),

PhpStorm Mac version
The latest (2018.2.1) professional PHP integrated development tool

SublimeText3 Chinese version
Chinese version, very easy to use

MinGW - Minimalist GNU for Windows
This project is in the process of being migrated to osdn.net/projects/mingw, you can continue to follow us there. MinGW: A native Windows port of the GNU Compiler Collection (GCC), freely distributable import libraries and header files for building native Windows applications; includes extensions to the MSVC runtime to support C99 functionality. All MinGW software can run on 64-bit Windows platforms.

