


Graphics drawing tool - matplotlib installation tutorial
1. Introduction
matplotlib is a powerful Python drawing library used to generate various types of graphics , including line charts, scatter charts, bar charts, pie charts, etc. Its installation is very simple and convenient. This article will introduce how to install matplotlib and give specific code examples.
2. Install matplotlib
- Install Python
First, make sure your computer has Python installed. You can download and install the latest version of Python on the Python official website (https://www.python.org/downloads/). -
Install pip
Pip is a Python package manager, we can use it to install various Python libraries. After installing Python, you can check whether pip is installed by running the following command:pip --version
If the version number of pip appears, it means that pip has been successfully installed. If it is not installed, you can execute the following command in the terminal to install pip:
python -m ensurepip --default-pip
-
Install matplotlib
After installing pip, we can install matplotlib through the following command:pip install matplotlib
This command will automatically download and install the latest version of the matplotlib library.
3. Drawing using matplotlib
Below we use some specific code examples to demonstrate the drawing function of matplotlib.
-
Line chart
The line chart is a common chart used to display data trends. The following is a simple line chart drawing example:import matplotlib.pyplot as plt # 数据 x = [1, 2, 3, 4, 5] y = [1, 4, 9, 16, 25] # 创建画布和子图 plt.figure() plt.plot(x, y) # 设置标题和坐标轴标签 plt.title("折线图示例") plt.xlabel("X轴") plt.ylabel("Y轴") # 显示图表 plt.show()Run the above code to generate a simple line chart.
-
Scatter plot
Scatter plot can be used to show the relationship between two variables. The following is a simple scatter plot drawing example:import matplotlib.pyplot as plt # 数据 x = [1, 2, 3, 4, 5] y = [1, 4, 9, 16, 25] # 创建画布和子图 plt.figure() plt.scatter(x, y) # 设置标题和坐标轴标签 plt.title("散点图示例") plt.xlabel("X轴") plt.ylabel("Y轴") # 显示图表 plt.show()Run the above code to generate a simple scatter plot.
-
Histogram
Histogram can be used to compare the size of data between different categories. The following is a simple histogram drawing example:import matplotlib.pyplot as plt # 数据 x = ['A', 'B', 'C', 'D', 'E'] y = [10, 30, 20, 40, 50] # 创建画布和子图 plt.figure() plt.bar(x, y) # 设置标题和坐标轴标签 plt.title("柱状图示例") plt.xlabel("类别") plt.ylabel("数据") # 显示图表 plt.show()Run the above code to generate a simple histogram.
4. Summary
The above is a simple tutorial on installing and using the matplotlib drawing library. With this powerful Python library, we can easily draw various types of graphs, which helps in displaying and analyzing data. I hope this article will be helpful to readers who are new to matplotlib.
The above is the detailed content of Graphic drawing tool - matplotlib installation tutorial. For more information, please follow other related articles on the PHP Chinese website!

 3分钟快速使用ChatGPT教程,用它帮我写简历,太牛了Apr 11, 2023 pm 07:40 PM
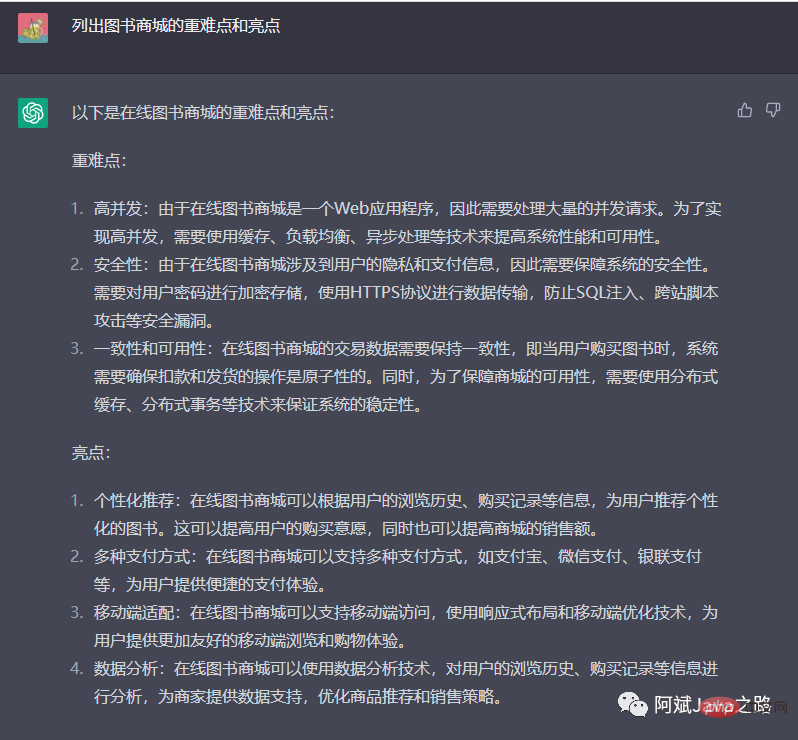
已经火了很久了,身边的同事也用它来进行一些调研,资源检索,工作汇报等方面都有很大的的效率提升。很多人问ChatGPT会不会取代程序员?我的回答是:不会!ChatGPT并不是我们的敌人,相反的是,它是我们的好帮手。未来人和人的竞争,可能就会从原先的我懂得更多,我实操经验更丰富,变成了我比你更会用工具,我比你更懂得提问,我比你更会发挥机器人的最大特性,所以,为了不掉队,你还不准备体验下ChatGPT吗?快速体验面试官经常会问你的项目有啥重难点?很多人不会回答,直接看看ChatGPT怎么说,真的太牛了
 教大家win10电脑怎么屏蔽各种弹窗广告Jul 09, 2023 pm 05:57 PM
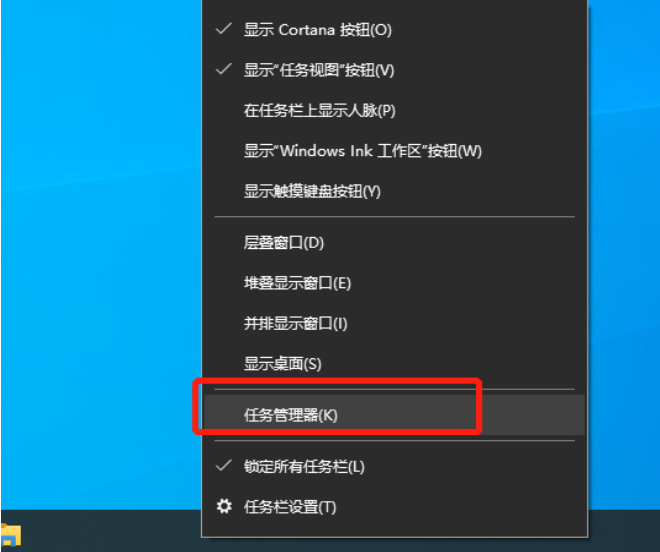
电脑上广告弹窗太多了怎么办,有的小伙伴不想重装系统,下面就和大家讲讲关闭win10广告的方法吧,大家可以借鉴一下。1、右键点击电脑桌面下方任务栏,在弹出的菜单中选择并打开“任务管理器”。2、右键点击需要关闭的启动项,选择“禁用”。对应软件的开机启动项就关闭成功了。弹窗拦截设置1、打开毒霸,在首页点击左下方的“弹窗拦截”。2、点击“扫描”,对电脑进行全面扫描找出带有弹窗的软件。3、勾选需要拦截的软件,然后点击“一键拦截”。4、一键拦截后,对应的软件弹窗问题就已被拦截了。综上所述,如果大家电脑win
 u盘怎么重装win11系统的步骤教程Jul 08, 2023 pm 09:33 PM
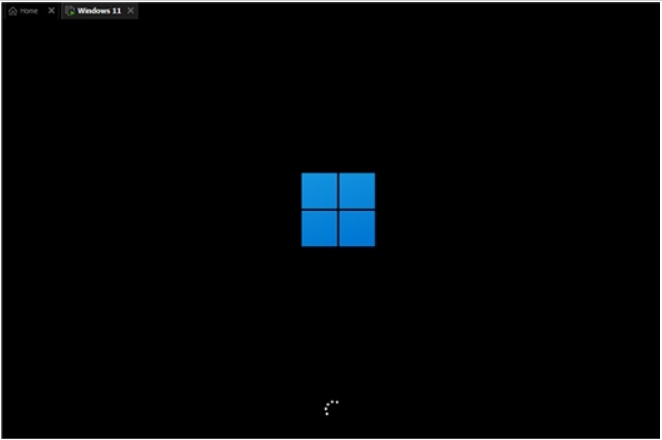
微软近日透露了将推出win11系统,很多用户都在期待新系统呢。网上已经有泄露关于win11的镜像安装系统。大家不知道如何安装的话,可以使用U盘来进行安装。小编现在就给大家带来了win11的U盘安装教程。1、首先准备一个8G以上大小的u盘,将它制作成系统盘。2、接着下载win11系统镜像文件,将它放入u盘中,大家可以直接点击右侧的链接进行下载。3、下载完成后装载该iso文件。4、装载完成之后会进入新的文件夹,在其中找到并运行win11的安装程序。5、在列表中选择“win11”然后点击“下一步”。6
 2023年最流行的5个php开发框架视频教程推荐May 08, 2017 pm 04:26 PM
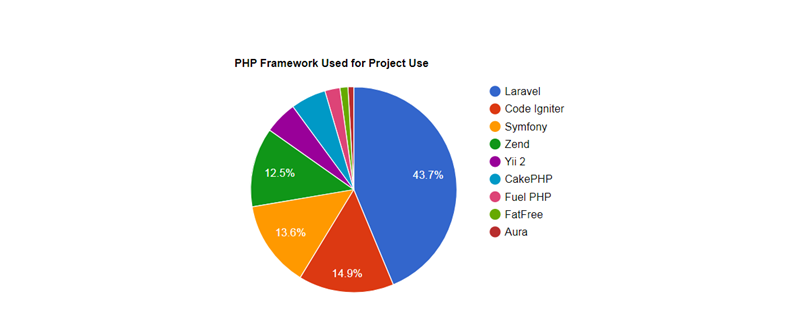
如果想快速进行php web开发,选择一个好用的php开发框架至关重要,一个好的php开发框架可以让开发工作变得更加快捷、安全和有效。那2023年最流行的php开发框架有哪些呢?这些php开发框架排名如何?
 PHP基础教程:从入门到精通Jun 18, 2023 am 09:43 AM
PHP是一种广泛使用的开源服务器端脚本语言,它可以处理Web开发中所有的任务。PHP在网页开发中的应用广泛,尤其是在动态数据处理上表现优异,因此被众多开发者喜爱和使用。在本篇文章中,我们将一步步地讲解PHP基础知识,帮助初学者从入门到精通。一、基本语法PHP是一种解释性语言,其代码类似于HTML、CSS和JavaScript。每个PHP语句都以分号;结束,注
 老电脑系统xp升级win7教程步骤Jul 07, 2023 pm 10:21 PM
xp系统曾经是使用最多的系统,不过随着硬件的不断升级,xp系统已经不能发挥硬件的性能,所以很多朋友就想升级win7系统,下面就和大家分享一下老电脑升级win7系统的方法吧。1、在小白一键重装系统官网中下载小白三步装机版软件并打开,软件会自动帮助我们匹配合适的系统,然后点击立即重装。2、接下来软件就会帮助我们直接下载系统镜像,只需要耐心等候即可。3、下载完成后软件会帮助我们直接进行在线重装Windows系统,请根据提示操作。4、安装完成后会提示我们重启,选择立即重启。5、重启后在PE菜单中选择Xi
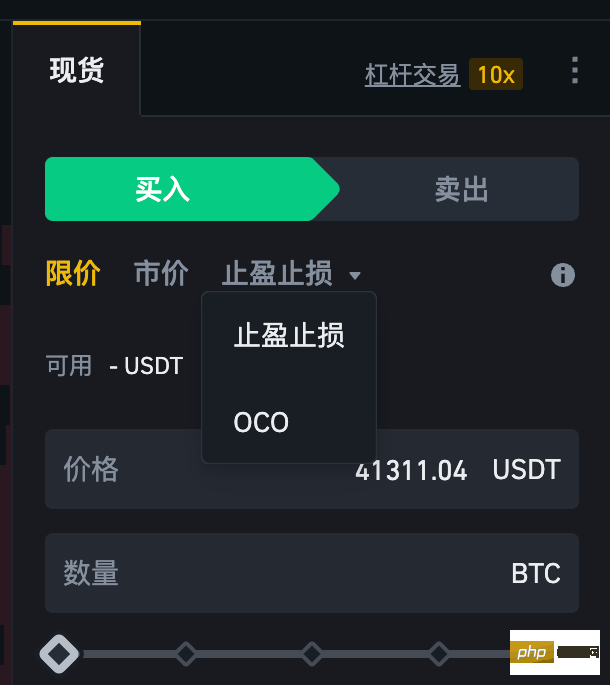 什么是OCO订单?Apr 25, 2023 am 11:26 AM
二选一订单(OneCancelstheOther,简称OCO)可让您同时下达两个订单。它结合了限价单和限价止损单,但只能执行其中一个。换句话说,只要其中的限价单被部分或全部成交、止盈止损单被触发,另一个订单将自动取消。请注意,取消其中一个订单也会同时取消另一个订单。在币安交易平台进行交易时,您可以将二选一订单作为交易自动化的基本形式。这个功能可让您选择同时下达两个限价单,从而有助于止盈和最大程度减少潜在损失。如何使用二选一订单?登录您的币安帐户之后,请前往基本交易界面,找到下图所示的交易区域。点
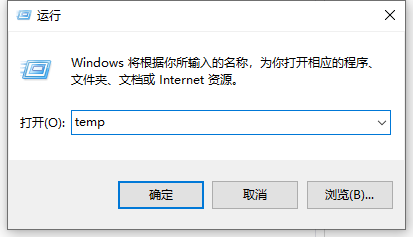 教你学会win10如何删除temp文件夹Jul 08, 2023 pm 04:13 PM
在win10的系统盘中,很多网友会看到一个temp文件夹,里面占用的内存非常大,占用了c盘很多空间。有网友想删除temp文件夹,但是不知道能不能删,win10如何删除temp文件夹。下面小编就教下大家win10删除temp文件夹的方法。首先,Temp是指系统临时文件夹。而很多收藏夹,浏览网页的临时文件都放在这里,这是根据你操作的过程临时保存下来的。如有需要,可以手动删除的。如何删除temp文件夹?具体步骤如下:方法一:1、按下【Win+R】组合键打开运行,在运行框中输入temp,点击确定;2、此


Hot AI Tools

Undresser.AI Undress
AI-powered app for creating realistic nude photos

AI Clothes Remover
Online AI tool for removing clothes from photos.

Undress AI Tool
Undress images for free

Clothoff.io
AI clothes remover

AI Hentai Generator
Generate AI Hentai for free.

Hot Article
Hot Tools

Zend Studio 13.0.1
Powerful PHP integrated development environment

mPDF
mPDF is a PHP library that can generate PDF files from UTF-8 encoded HTML. The original author, Ian Back, wrote mPDF to output PDF files "on the fly" from his website and handle different languages. It is slower than original scripts like HTML2FPDF and produces larger files when using Unicode fonts, but supports CSS styles etc. and has a lot of enhancements. Supports almost all languages, including RTL (Arabic and Hebrew) and CJK (Chinese, Japanese and Korean). Supports nested block-level elements (such as P, DIV),

Notepad++7.3.1
Easy-to-use and free code editor

ZendStudio 13.5.1 Mac
Powerful PHP integrated development environment

VSCode Windows 64-bit Download
A free and powerful IDE editor launched by Microsoft

