 Web Front-end
 H5 Tutorial
 IE10 Error.stack makes script debugging more convenient and faster_html5 tutorial tips
Error.stack support has been newly added in IE10, which can speed up developers' script debugging and error correction. Especially some errors that are difficult to reproduce, such as asynchronous operations. The following content comes from the Microsoft IE team, which describes this feature in great detail.
Debugging applicationsStructured error handling in JavaScript relies on throw and try/catch, where the developer will declare an error and pass control flow to a part of the program that handles the error. When an error is raised, Chakra, the JavaScript engine in Internet Explorer, captures the chain of calls that caused the error, a process also known as a call stack. If the object being thrown is a Error (or a function whose prototype chain leads to Error), then Chakra will create a stack trace, a human-readable list of the call stack. The list will be represented as a property, a Error in the stack object. stack Contains the error message, function name, and source file location information for the function. This information will help developers understand the functions being called and even view the erroneous lines of code to quickly diagnose the flaw. For example, the information might indicate that one of the parameters passed to the function was empty or of an invalid type.
Let’s look at a simple script and start a deeper discussion. This script attempts to calculate the distance between the two points (0, 2) and (12, 10):
(function () {
'use strict';
function squareRoot(n) {
if (n throw new Error('Cannot take square root of negative number.');
return Math.sqrt(n);
}
function square(n) {
return n * n;
}
function pointDistance (pt1, pt2) {
return squareRoot((pt1.x - pt2.x) (pt1.y - pt2.y));
}
function sample() {
var pt1 = { x: 0, y: 2 };
var pt2 = { x: 12, y: 10 };
console.log('Distance is: ' pointDistance(pt1, pt2));
}
try {
sample();
}
catch (e) {
console.log(e.stack);
}
})();
This script contains a flaw where it does not adjust for differences between components. Therefore, for some inputs, the
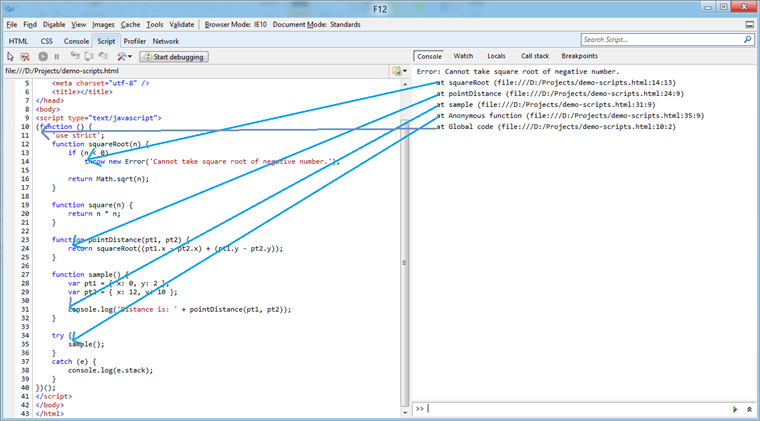
pointDistance function will return incorrect results; in other cases, the script will cause errors. To understand what the stack trace means, let's take a look at the error in the F12 Developer Tools and look at its Scripts tab:

stack trace will be dumped to the console in the catch clause, so errors originating in the squareRoot function will become obvious since it is at the top of the stack. In order to debug this issue, the developer does not need to look deeply into the stack trace; the system has violated the precondition of squareRoot, and it will become obvious just by looking one level up the stack: the subexpression within the squareRoot call The formula itself should be the parameter of square.
During debugging, the stack attribute will help identify the code used to set breakpoints. Keep in mind that you can also use other methods to view the call stack: For example, if you set the script debugger to "catch exceptions and break on" mode, you can use the debugger to examine the call stack. For deployed applications, you may consider merging the problematic code within try/catch to capture the failed call and log it to the server. Developers can then review the call stack to isolate the problem area.
Previously, I had noticed that the object being raised must be a Error or lead to a Error via its prototype chain. This is intentional; JavaScript can support raising any object, even primitives that are exceptions. Although all of these objects can be captured and inspected by the system, their full purpose is not to contain error or diagnostic information. Therefore, only the error's stack attributes will be updated during the raising process.
Even if objects are DOM exceptions, they do not contain a prototype chain leading to Error, so they will not contain stack attributes. In some application scenarios, you need to perform DOM manipulation and want to expose JavaScript-compatible errors, then you may want to merge your DOM manipulation code inside the try/catch data block and raise a new one in the catch clause The Error object:
function causesDomError( ) {
try {
var div = document.createElement('div');
div.appendChild(div);
} catch (e) {
throw new Error(e. toString());
}
}
However, you may want to consider whether to use this pattern. This is probably the most appropriate pattern for utility library development, especially if you consider whether the intent of the code is to hide DOM manipulation or simply perform a task. If the purpose is to hide DOM operations, then merging operations and raising
Error is probably the right approach we need to choose.
Performance considerations
Construction of the stack trace begins when the error object is raised; constructing the stack trace requires viewing the current execution stack. To prevent performance issues when traversing very large stacks (and even possible recursive stack chains), IE will only collect the first ten stack frames by default. However this setting can be configured by setting the static property Error.stackTraceLimit to another value. This setting is global and must be changed before an error is raised, otherwise it will have no effect on the stack trace.
When a stack is generated by an asynchronous callback (such as timeout, interval, or XMLHttpRequest), the asynchronous callback (not the code created by the asynchronous callback) will be at the bottom of the call stack. This has some potential implications for tracing problematic code: if you use the same callback function for multiple asynchronous callbacks, it will be difficult to determine which callback is causing the error by individual inspection. Let's modify the previous example slightly, we will avoid calling sample() directly and instead put it into a timeout callback:
(function () {
'use strict';
function squareRoot(n) {
if (n throw new Error('Cannot take square root of negative number.');
return Math.sqrt(n);
}
function square(n) {
return n * n;
}
function pointDistance(pt1 , pt2) {
return squareRoot((pt1.x - pt2.x) (pt1.y - pt2.y));
}
function sample() {
var pt1 = { x : 0, y: 2 };
var pt2 = { x: 12, y: 10 };
console.log('Distance is: ' pointDistance(pt1, pt2));
}
setTimeout(function () {
try {
sample();
}
catch (e) {
console.log(e.stack);
}
}, 2500);
})();
Once this code snippet is executed, you will notice a slight delay in the stack trace. At this point, you will also notice that the bottom of the stack is not the global code
Anonymous function. In fact, this is not the same anonymous function, but the callback function passed to setTimeout. Since you lose the context associated with the pending callback, you may not be able to determine what called the callback. If in an application scenario, the system registers a callback to handle click events for many different buttons, then you will not be able to tell which callback the registration refers to. Having said that, this restriction is of limited use as in most cases the top of the stack will probably highlight the problem area.
Watch the experience demo

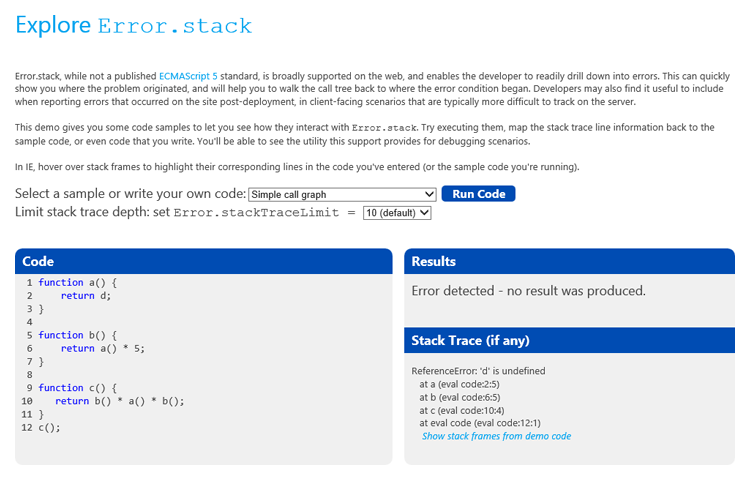
Learn about using IE10 in Windows 8 Consumer Preview. You can execute code in the context of eval and if an error occurs, you can check for it. If you're running the code within IE10, you can also highlight the erroring line of code since you can hover over it in the stack trace. You can enter your own code into the code area, or choose from several examples in the list. Additionally, you can set the Error.stackTraceLimit value when running the code example.
To view reference materials, please browse the related information Error.stack and <a target="_blank" href="http://msdn.microsoft.com/en-us/library%20MSDN%20documentation%20for%20/hh699849(v=vs.94).aspx">stackTraceLimit<code><a target="_blank" href="http://msdn.microsoft.com/en-us/library/hh699849(v=vs.94).aspx">stackTraceLimit</a>.
 How to Add Audio to My HTML5 Website?Mar 10, 2025 pm 03:01 PM
This article explains how to embed audio in HTML5 using the <audio> element, including best practices for format selection (MP3, Ogg Vorbis), file optimization, and JavaScript control for playback. It emphasizes using multiple audio f
 How do I handle user location privacy and permissions with the Geolocation API?Mar 18, 2025 pm 02:16 PM
The article discusses managing user location privacy and permissions using the Geolocation API, emphasizing best practices for requesting permissions, ensuring data security, and complying with privacy laws.
 How do I use the HTML5 Page Visibility API to detect when a page is visible?Mar 13, 2025 pm 07:51 PM
The article discusses using the HTML5 Page Visibility API to detect page visibility, improve user experience, and optimize resource usage. Key aspects include pausing media, reducing CPU load, and managing analytics based on visibility changes.
 How do I use viewport meta tags to control page scaling on mobile devices?Mar 13, 2025 pm 08:00 PM
The article discusses using viewport meta tags to control page scaling on mobile devices, focusing on settings like width and initial-scale for optimal responsiveness and performance.Character count: 159
 How to Use HTML5 Forms for User Input?Mar 10, 2025 pm 02:59 PM
This article explains how to create and validate HTML5 forms. It details the <form> element, input types (text, email, number, etc.), and attributes (required, pattern, min, max). The advantages of HTML5 forms over older methods, incl
 How to Create Interactive Games with HTML5 and JavaScript?Mar 10, 2025 pm 06:34 PM
This article details creating interactive HTML5 games using JavaScript. It covers game design, HTML structure, CSS styling, JavaScript logic (including event handling and animation), and audio integration. Essential JavaScript libraries (Phaser, Pi
 How do I use the HTML5 Drag and Drop API for interactive user interfaces?Mar 18, 2025 pm 02:17 PM
The article explains how to use the HTML5 Drag and Drop API to create interactive user interfaces, detailing steps to make elements draggable, handle key events, and enhance user experience with custom feedback. It also discusses common pitfalls to a
 How do I use the HTML5 WebSockets API for bidirectional communication between client and server?Mar 12, 2025 pm 03:20 PM
This article explains the HTML5 WebSockets API for real-time, bidirectional client-server communication. It details client-side (JavaScript) and server-side (Python/Flask) implementations, addressing challenges like scalability, state management, an


Hot AI Tools

Undresser.AI Undress
AI-powered app for creating realistic nude photos

AI Clothes Remover
Online AI tool for removing clothes from photos.

Undress AI Tool
Undress images for free

Clothoff.io
AI clothes remover

AI Hentai Generator
Generate AI Hentai for free.

Hot Article

Hot Tools

SublimeText3 Chinese version
Chinese version, very easy to use

Dreamweaver Mac version
Visual web development tools

WebStorm Mac version
Useful JavaScript development tools

Notepad++7.3.1
Easy-to-use and free code editor

SecLists
SecLists is the ultimate security tester's companion. It is a collection of various types of lists that are frequently used during security assessments, all in one place. SecLists helps make security testing more efficient and productive by conveniently providing all the lists a security tester might need. List types include usernames, passwords, URLs, fuzzing payloads, sensitive data patterns, web shells, and more. The tester can simply pull this repository onto a new test machine and he will have access to every type of list he needs.


