


How to use Highcharts to create interactive data visualization
Introduction:
With the advent of the big data era, data visualization has become an important tool for many companies and individuals to process data. Important tool. As a powerful yet easy-to-use data visualization library, Highcharts is widely used in fields such as web development, data analysis, and report presentation. This article will introduce how to use Highcharts to create interactive data visualization and give specific code examples.
1. Preparation
First, you need to introduce the Highcharts library file into the web page. You can download the latest version of Highcharts from the official website (https://www.highcharts.com.cn or https://www.highcharts.com) and place it in your project directory.
Then, add the following code within the
tag of the HTML file to introduce Highcharts and related style files:<script src="路径/highcharts.js"></script> <link rel="stylesheet" href="路径/highcharts.css">
where path is your The specific path to place the Highcharts library file.
2. Create a chart container
Add a
<div id="container" style="width: 600px; height: 400px;"></div>
where container is the unique identifier of the chart container, which you can customize.
3. Draw basic charts
Next, we start using Highcharts to create interactive data visualization charts.
First, create an empty Highcharts chart object and specify the container and basic configuration options. For example:
Highcharts.chart('container', {
    chart: {
        type: 'bar'  //指定图表类型为柱状图
    },
    title: {
        text: '销售数据'  //设置图表标题
    },
    xAxis: {
        categories: ['一月', '二月', '三月', '四月', '五月']  //设置x轴刻度标签
    },
    yAxis: {
        title: {
            text: '销售额'  //设置y轴标题
        }
    },
    series: [{
        name: '销售额',  //设置数据系列名称
        data: [100, 200, 150, 300, 250]  //设置数据系列的数据
    }]
});
The above code creates a histogram, with the x-axis representing the month and the y-axis representing the sales, visually displaying the sales in different months.
4. Configuring data series and interactive functions
In addition to basic chart configuration, Highcharts also provides a wealth of configuration options that can be set according to actual needs.
-
Configuring data series
Highcharts supports multiple data series, and can configure attributes such as styles and labels for each data series. For example:series: [{ name: '销售额', data: [100, 200, 150, 300, 250], color: '#ff9900' //设置数据系列的颜色 }, { name: '利润', data: [80, 150, 120, 200, 180], color: '#66cc00' }]The above code creates two data series, representing sales and profits respectively, and assigns colors to each data series.
-
Add interactive functions
Highcharts supports a variety of interactive functions, including mouse hover, click events, smooth animation, etc. The following is an example of adding mouse hover prompts and click events:tooltip: { shared: true //启用鼠标悬停提示共享 }, plotOptions: { series: { cursor: 'pointer', point: { events: { click: function () { alert('你点击了 ' + this.category + ' 月的数据'); //点击事件处理函数 } } } } }The above code designs mouse hover prompts and click events. When the mouse hovers over a data point, the specific information of the data point will be displayed. Value; when a data point is clicked, a prompt box will pop up to display the clicked month.
5. Further customization
In addition to the above basic settings and interactive functions, Highcharts also provides many other customization options, such as modifying the chart style and setting the coordinate axis range. , add legends, etc. When creating a chart, you can further customize the chart's appearance and behavior based on your needs.
Conclusion:
This article briefly introduces how to use Highcharts to create interactive data visualization charts. With a few simple steps, you can quickly get started with Highcharts and create beautiful and practical data visualization charts according to your own needs. I hope this article will help you with data processing and display in actual projects.
Reference: https://www.highcharts.com/docs
The above is the detailed content of How to create interactive data visualizations with Highcharts. For more information, please follow other related articles on the PHP Chinese website!

 Windows 11 Recovery USB:下载、安装和创建Jul 05, 2023 pm 01:05 PM
您的PC有时会遇到问题,导致难以正常启动。在这种情况下,您可以使用Windows11恢复USB恢复它。虽然这一切看起来简单明了,但您仍然需要知道如何创建和使用恢复USB。在本指南中,我们将引导您完成轻松执行此任务所需的步骤。我可以下载Windows11恢复USB吗?如果您的操作系统完全崩溃,您可以从另一台运行良好的PC下载Windows11恢复USB。但是,要从中创建恢复驱动器的电脑必须与你的电脑具有相同的体系结构。最好的选择仍然是在PC正常运行时从PC创建USB。这消除了任何兼容性风险。或者,
 win11怎么创建本地连接Jun 29, 2023 pm 12:55 PM
win11怎么创建本地连接?有小伙伴在升级到win11系统之后,发现一些功能没办法正常使用,有小伙伴使用本地连接得时候,发现没有办法正常连接,不能正常连接的话,就没有办法上网,那么我们应该如何解决呢。小编下面整理了win11创建本地连接步骤,感兴趣的话,跟着小编一起往下看看吧!win11创建本地连接步骤1、点击桌面开始菜单,打开设置面板,如图所示。2、找到网络和Internet选项,如图所示。3、点击设置拨号连接按钮,如图所示。4、点击该栏目下的设置新连接选项,如图所示。5、最后点击设置新网络图
 Win11如何创建电源计划Jun 29, 2023 pm 01:15 PM
Win11如何创建电源计划?电源计划是管理计算机如何使用和节省电源的硬件和系统设置的集合。近期有用户在问Win11如何创建电源计划?其实方法很简单,还不清楚应该如何操作的朋友们可以来看看下面这篇Win11自定义电源计划的技巧,希望你会喜欢。 Win11自定义电源计划的技巧 在Windows11上创建自定义电源计划 打开开始菜单并键入控制面板。 从搜索结果中选择控制面板。 在控制面板中,将查看方式选项更改为大图标。 接下来,选择电源选项。 单击电源选项菜单中的创建电源计划选项。
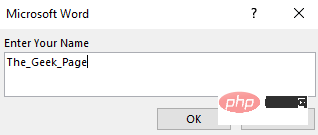 如何在 Microsoft Word 中创建用户输入提示Apr 14, 2023 pm 04:40 PM
假设您有一个要求,您必须从50个人那里收集数据。您可以将Word文件发送给他们,他们可以轻松填写。但是您需要所有50个文档中的格式和对齐方式以及其他所有内容都相同。好吧,如果您将原始Word文件提供给这50个人,而不是50个相同的文档,您将得到50个完全不同的文档,不用说。那么,有解决办法吗?当然,您知道我们总有适合您的解决方案!让我们谈谈模板!Word模板是您的任务的完美解决方案。通过使用Word模板,您可以在用户打开模板文档时提示他们输入一些数据。他们可以在用户提
 使用Yii框架创建电影网站Jun 21, 2023 am 09:04 AM
随着互联网的普及以及人们对电影的热爱,电影网站成为了一个受欢迎的网站类型。在创建一个电影网站时,一个好的框架是非常必要的。Yii框架是一个高性能的PHP框架,易于使用且具有出色的性能。在本文中,我们将探讨如何使用Yii框架创建一个电影网站。安装Yii框架在使用Yii框架之前,需要先安装框架。安装Yii框架非常简单,只需要在终端执行以下命令:composer
 MySQL表设计教程:创建一个简单的留言板表Jul 02, 2023 pm 03:40 PM
MySQL表设计教程:创建一个简单的留言板表介绍在网站开发中,留言板是一个非常常见的功能,用于让用户在网站上发表评论、建立联系等。在设计留言板功能时,一个重要的步骤是创建适当的数据表来存储留言的信息。本文将教你如何使用MySQL来创建一个简单的留言板表。步骤一:创建数据库首先,我们需要创建一个数据库来存储留言板的数据。可以使用以下代码创建数据库:CREATE
 MySQL表设计教程:创建一个简单的用户积分表Jul 02, 2023 am 10:12 AM
MySQL表设计教程:创建一个简单的用户积分表标题:MySQL表设计教程:创建一个简单的用户积分表导语:在开发常见的用户系统中,积分系统是一个重要的组成部分。本文将教你如何使用MySQL创建一个简单的用户积分表,并附带代码示例,帮助你更好地理解和实践该表设计。正文:确定表的名称和字段首先,我们需要确定表的名称和表中所需的字段。对于用户积分表,我们可以将其命名
 MySQL表设计教程:创建一个简单的新闻表Jul 02, 2023 pm 03:08 PM
MySQL表设计教程:创建一个简单的新闻表在开发网站或应用程序时,新闻表是一个常见的数据库表之一。它用于存储和管理新闻文章的相关信息,如标题、内容、作者、发布日期等。本文将介绍如何使用MySQL创建一个简单的新闻表,并给出相应的代码示例。首先,我们需要创建一个数据库来存储新闻表。可以使用以下代码来创建一个名为"news_db"的数据库:CREATEDATA


Hot AI Tools

Undresser.AI Undress
AI-powered app for creating realistic nude photos

AI Clothes Remover
Online AI tool for removing clothes from photos.

Undress AI Tool
Undress images for free

Clothoff.io
AI clothes remover

AI Hentai Generator
Generate AI Hentai for free.

Hot Article
Hot Tools

Safe Exam Browser
Safe Exam Browser is a secure browser environment for taking online exams securely. This software turns any computer into a secure workstation. It controls access to any utility and prevents students from using unauthorized resources.

SublimeText3 Linux new version
SublimeText3 Linux latest version

SublimeText3 Chinese version
Chinese version, very easy to use

Notepad++7.3.1
Easy-to-use and free code editor

SublimeText3 Mac version
God-level code editing software (SublimeText3)

