


Anomaly detection problems based on time series require specific code examples
Time series data is data recorded in a certain order over time, such as stock prices, temperatures changes, traffic flow, etc. In practical applications, anomaly detection of time series data is of great significance. An outlier can be an extreme value that is inconsistent with normal data, noise, erroneous data, or an unexpected event in a specific situation. Anomaly detection can help us discover these anomalies and take appropriate measures.
There are many commonly used methods for anomaly detection in time series, including statistical methods, machine learning methods and deep learning methods. This article will introduce two time series anomaly detection algorithms based on statistical methods and machine learning methods, and provide corresponding code examples.
1. Anomaly detection algorithm based on statistical methods
1.1 Mean-variance method
The mean-variance method is one of the simplest anomaly detection methods. The basic idea is to determine whether there are abnormalities based on the mean and variance of time series data. If the deviation of a data point from the mean is greater than a certain threshold (for example, 3 times the standard deviation), it is judged to be an anomaly.
The following is a code example of using Python to implement the mean-variance method for time series anomaly detection:
import numpy as np

def detect_outliers_mean_std(data, threshold=3):
    mean = np.mean(data)
    std = np.std(data)
    outliers = []

    for i in range(len(data)):
        if abs(data[i] - mean) > threshold * std:
            outliers.append(i)

    return outliers

# 示例数据
data = [1, 2, 3, 4, 5, 20, 6, 7, 8, 9]

# 检测异常值
outliers = detect_outliers_mean_std(data)
print("异常数据索引:", outliers)
Running results:
Abnormal data index: [5]
1.2 Box plot method
The box plot method is another commonly used anomaly detection method. It determines outliers based on the quartiles of the data (upper and lower quartiles, median). Based on the median (Q2) and the upper and lower quartiles (Q1, Q3), the upper and lower boundaries can be calculated. If the data point exceeds this boundary, it is judged as an anomaly.
The following is a code example of using Python to implement box plot method for time series anomaly detection:
import numpy as np
import seaborn as sns

def detect_outliers_boxplot(data):
    q1 = np.percentile(data, 25)
    q3 = np.percentile(data, 75)
    iqr = q3 - q1
    outliers = []

    for i in range(len(data)):
        if data[i] < q1 - 1.5 * iqr or data[i] > q3 + 1.5 * iqr:
            outliers.append(i)

    return outliers

# 示例数据
data = [1, 2, 3, 4, 5, 20, 6, 7, 8, 9]

# 绘制箱型图
sns.boxplot(data=data)
# 检测异常值
outliers = detect_outliers_boxplot(data)
print("异常数据索引:", outliers)
Running results:
Abnormal data index: [5]
2. Anomaly detection algorithm based on machine learning method
2.1 Isolated forest algorithm
The isolated forest algorithm is an anomaly detection method based on unsupervised learning. It uses the segmentation method of decision trees to determine the abnormality of data points. The isolation forest algorithm assumes that outliers have a lower density on the feature space, so when building a decision tree, the path length of outliers will be shorter.
The following is a code example of using Python to implement the isolation forest algorithm for time series anomaly detection:
from sklearn.ensemble import IsolationForest

def detect_outliers_isolation_forest(data):
    model = IsolationForest(contamination=0.1, random_state=0)
    model.fit(data.reshape(-1, 1))
    outliers = model.predict(data.reshape(-1, 1))

    return np.where(outliers == -1)[0]

# 示例数据
data = [1, 2, 3, 4, 5, 20, 6, 7, 8, 9]

# 检测异常值
outliers = detect_outliers_isolation_forest(data)
print("异常数据索引:", outliers)
Running results:
Abnormal data index: [5]
2.2 Time series decomposition method
The time series decomposition method is an anomaly detection method based on traditional statistical methods. It decomposes time series data into three parts: trend, seasonality and residual. By analyzing the residual difference to determine abnormal points.
The following is a code example of using Python to implement time series decomposition method for time series anomaly detection:
import statsmodels.api as sm

def detect_outliers_time_series(data):
    decomposition = sm.tsa.seasonal_decompose(data, model='additive')
    residuals = decomposition.resid
    outliers = []

    for i in range(len(residuals)):
        if abs(residuals[i]) > 2 * np.std(residuals):
            outliers.append(i)

    return outliers

# 示例数据
data = [1, 7, 3, 4, 5, 20, 6, 7, 8, 9]

# 检测异常值
outliers = detect_outliers_time_series(data)
print("异常数据索引:", outliers)
Running results:
Abnormal data index: [1, 5]
Conclusion
The problem of anomaly detection based on time series is a very important and practical problem. This article introduces two commonly used anomaly detection methods, including the mean-variance method and boxplot method based on statistical methods, and the isolation forest algorithm and time series decomposition method based on machine learning methods. Through the above code examples, readers can understand how to use Python to implement these algorithms and apply them to actual time series data for anomaly detection. I hope this article will be helpful to readers on time series anomaly detection.
The above is the detailed content of Anomaly detection problem based on time series. For more information, please follow other related articles on the PHP Chinese website!

 如何使用C#编写时间序列预测算法Sep 19, 2023 pm 02:33 PM
如何使用C#编写时间序列预测算法时间序列预测是一种通过分析过去的数据来预测未来数据趋势的方法。它在很多领域,如金融、销售和天气预报中有广泛的应用。在本文中,我们将介绍如何使用C#编写时间序列预测算法,并附上具体的代码示例。数据准备在进行时间序列预测之前,首先需要准备好数据。一般来说,时间序列数据应该具有足够的长度,并且是按照时间顺序排列的。你可以从数据库或者
 如何使用XGBoost和InluxDB进行时间序列预测Apr 04, 2023 pm 12:40 PM
XGBoost是一个流行的开源机器学习库,可用于解决各种预测问题。人们需要了解如何使用它与InfluxDB进行时间序列预测。 译者 | 李睿审校 | 孙淑娟XGBoost是一个开源的机器学习库,它实现了优化的分布式梯度增强算法。XGBoost使用并行处理实现快速性能,很好地处理缺失值,在小型数据集上执行良好,并防止过拟合。所有这些优点使XGBoost成为回归问题(例如预测)的一种流行解决方案。预测是各种业务目标的关键任务,例如预测分析、预测维护、产品规划、预算等。许多预测或预测问题都涉及到时间序
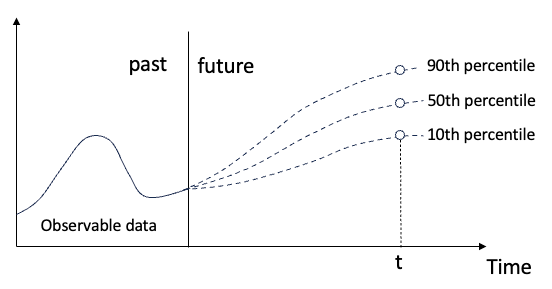 用于时间序列概率预测的分位数回归May 07, 2024 pm 05:04 PM
不要改变原内容的意思,微调内容,重写内容,不要续写。“分位数回归满足这一需求,提供具有量化机会的预测区间。它是一种统计技术,用于模拟预测变量与响应变量之间的关系,特别是当响应变量的条件分布命令人感兴趣时。与传统的回归方法不同,分位数回归侧重于估计响应变量变量的条件量值,而不是条件均值。”图(A):分位数回归分位数回归概念分位数回归是估计⼀组回归变量X与被解释变量Y的分位数之间线性关系的建模⽅法。现有的回归模型实际上是研究被解释变量与解释变量之间关系的一种方法。他们关注解释变量与被解释变量之间的关
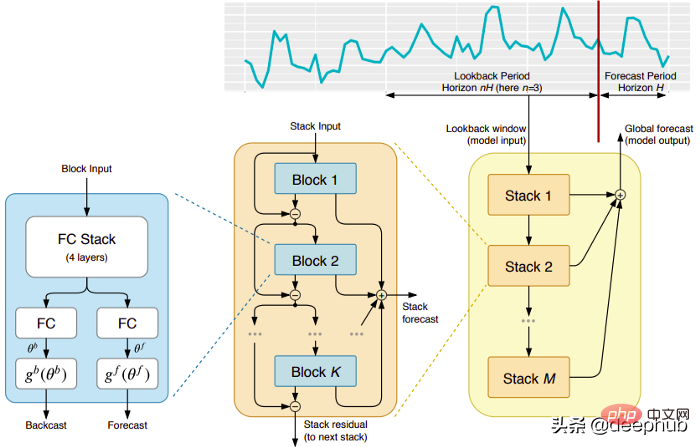
 时间序列预测+NLP大模型新作:为时序预测自动生成隐式PromptMar 18, 2024 am 09:20 AM
今天我想分享一个最新的研究工作,这项研究来自康涅狄格大学,提出了一种将时间序列数据与自然语言处理(NLP)大模型在隐空间上对齐的方法,以提高时间序列预测的效果。这一方法的关键在于利用隐空间提示(prompt)来增强时间序列预测的准确性。论文标题:S2IP-LLM:SemanticSpaceInformedPromptLearningwithLLMforTimeSeriesForecasting下载地址:https://arxiv.org/pdf/2403.05798v1.pdf1、问题背景大模型
 五个时间序列预测的深度学习模型对比总结May 05, 2023 pm 05:16 PM
MakridakisM-Competitions系列(分别称为M4和M5)分别在2018年和2020年举办(M6也在今年举办了)。对于那些不了解的人来说,m系列得比赛可以被认为是时间序列生态系统的一种现有状态的总结,为当前得预测的理论和实践提供了经验和客观的证据。2018年M4的结果表明,纯粹的“ML”方法在很大程度上胜过传统的统计方法,这在当时是出乎意料的。在两年后的M5[1]中,最的高分是仅具有“ML”方法。并且所有前50名基本上都是基于ML的(大部分是树型模型)。这场比赛看到了LightG
 如何用PHP实现异常检测与欺诈分析Jul 30, 2023 am 09:42 AM
如何用PHP实现异常检测与欺诈分析摘要:随着电子商务的发展,欺诈成为一个不可忽视的问题。本文介绍了如何用PHP实现异常检测与欺诈分析。通过收集用户交易数据和行为数据,结合机器学习算法,在系统中实时监测和分析用户行为,识别潜在的欺诈行为,并采取相应措施应对。关键词:PHP、异常检测、欺诈分析、机器学习一、引言随着电子商务的快速发展,人们在互联网上进行交易的数量
 2022年十个用于时间序列分析的Python库推荐Apr 13, 2023 am 08:22 AM
时间序列是数据点的序列,通常由在一段时间间隔内进行的连续测量组成。时间序列分析是使用统计技术对时间序列数据进行建模和分析,以便从中提取有意义的信息并做出预测的过程。时间序列分析是一个强大的工具,可以用来从数据中提取有价值的信息,并对未来的事件做出预测。它可以用来识别趋势、季节模式和变量之间的其他关系。时间序列分析还可以用来预测未来的事件,如销售、需求或价格变动。如果你正在使用Python处理时间序列数据,那么有许多不同的库可以选择。所以在本文中,我们将整理Python中最流行处理时间序列的库。S
 Python中的ARMA模型详解Jun 10, 2023 pm 03:26 PM
Python中的ARMA模型详解ARMA模型是统计学中一类重要的时间序列模型,它可以用于对时间序列数据的预测和分析。Python中提供了丰富的库和工具箱,可以方便地运用ARMA模型进行时间序列建模。本文将详细介绍Python中的ARMA模型。一、什么是ARMA模型ARMA模型是由自回归模型(AR模型)和移动平均模型(MA模型)组成的时间序列模型。其中,AR模


Hot AI Tools

Undresser.AI Undress
AI-powered app for creating realistic nude photos

AI Clothes Remover
Online AI tool for removing clothes from photos.

Undress AI Tool
Undress images for free

Clothoff.io
AI clothes remover

AI Hentai Generator
Generate AI Hentai for free.

Hot Article
Hot Tools

EditPlus Chinese cracked version
Small size, syntax highlighting, does not support code prompt function

VSCode Windows 64-bit Download
A free and powerful IDE editor launched by Microsoft

Dreamweaver Mac version
Visual web development tools

MinGW - Minimalist GNU for Windows
This project is in the process of being migrated to osdn.net/projects/mingw, you can continue to follow us there. MinGW: A native Windows port of the GNU Compiler Collection (GCC), freely distributable import libraries and header files for building native Windows applications; includes extensions to the MSVC runtime to support C99 functionality. All MinGW software can run on 64-bit Windows platforms.

PhpStorm Mac version
The latest (2018.2.1) professional PHP integrated development tool

